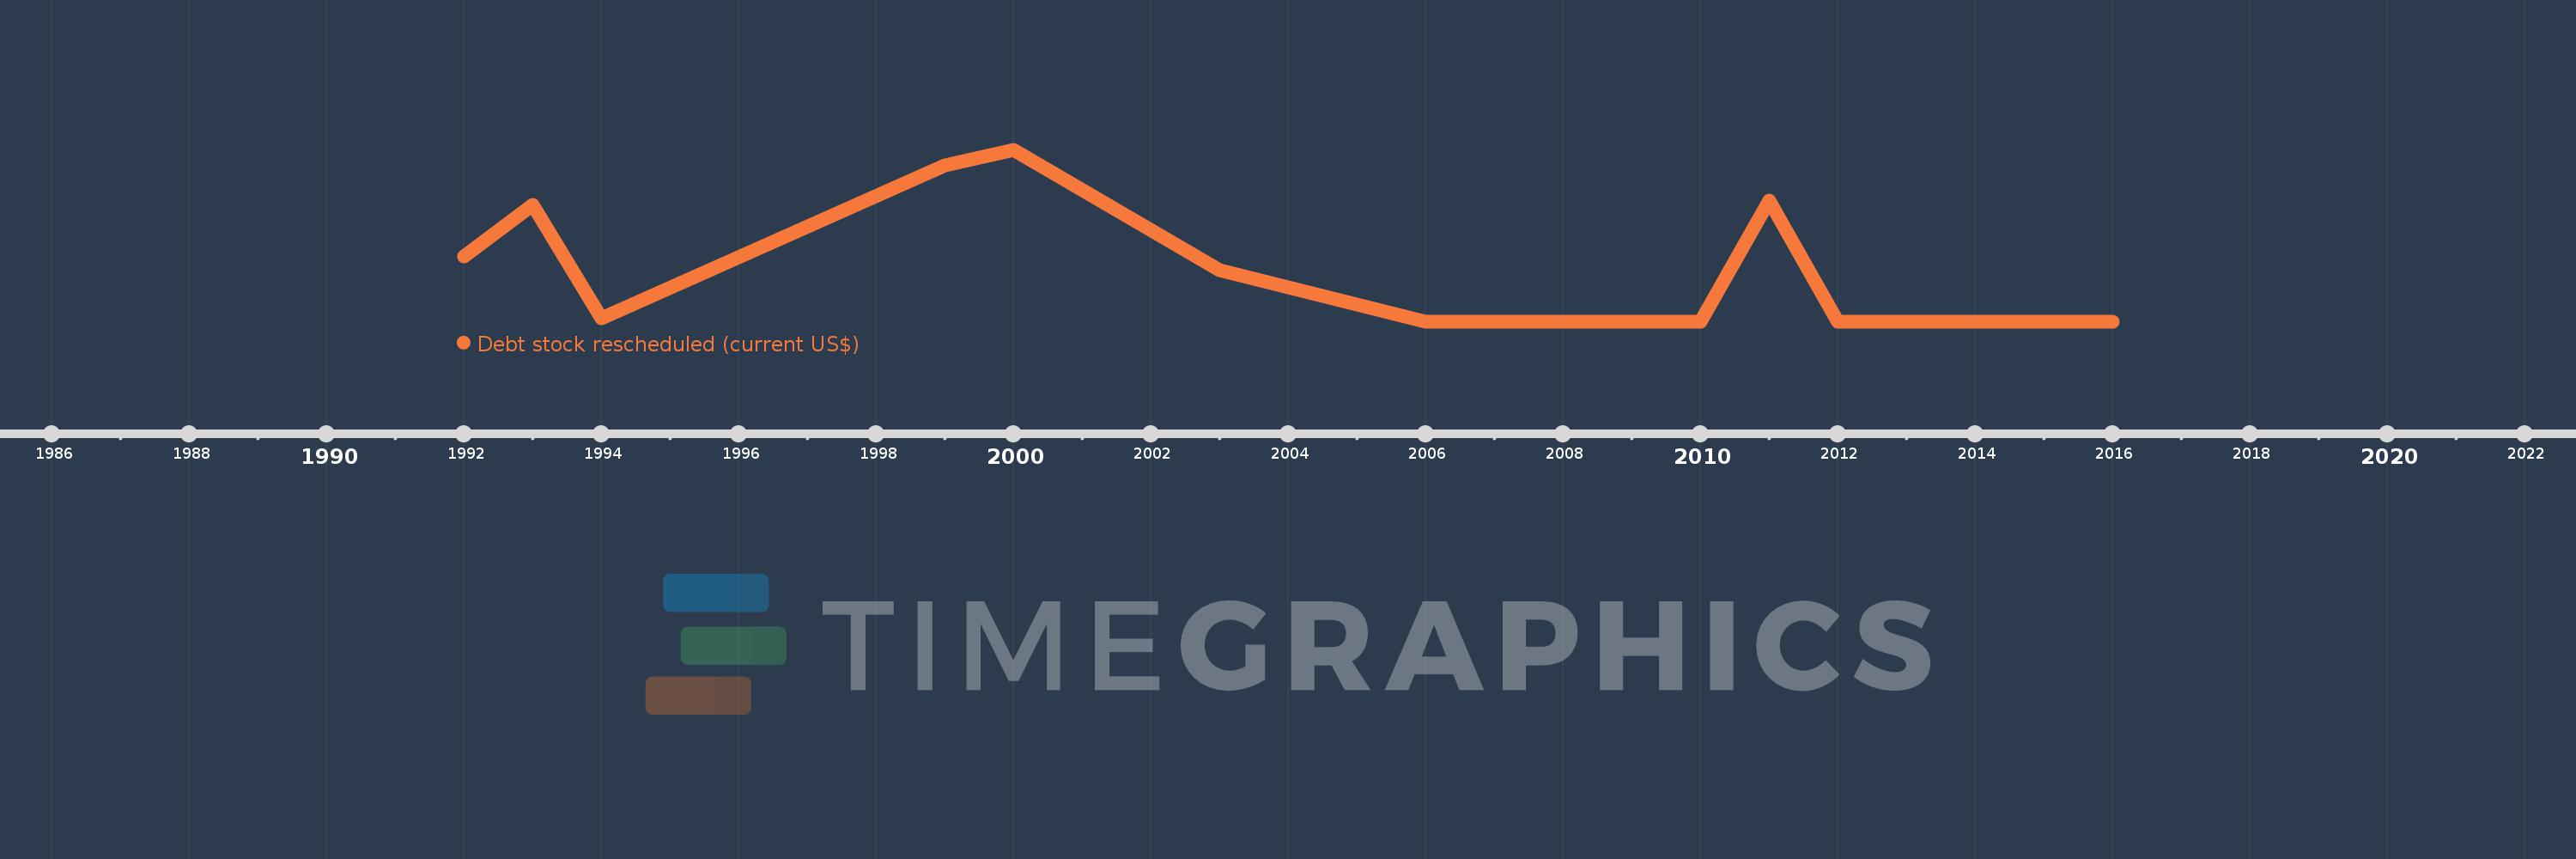
This timeline shows a graph from 1992 to 2016 of East Asia & Pacific (excluding high income). No data until 1991. Number of actual observations by date: 17.
Source name:
World Development Indicators
Source organization:
World Bank, International Debt Statistics.
Categories, topics:
External Debt
Last updated:
apr 23, 2017
Indicators value changes by year
Meaning:
778.212 mln
Minimum:
0.0
jan 1, 2006
Maximum:
3.3 bln
jan 1, 2000
At the date of observation
Value
Absolute change
Change from the previous value
jan 1, 1992
1.261 bln
+1.261 bln
0.0%
jan 1, 1993
2.255 bln
+993.578 mln
78.76%
jan 1, 1994
69.104 mln
-2.186 bln
-96.94%
jan 1, 1999
3.002 bln
+2.933 bln
4.24K%
jan 1, 2000
3.3 bln
+297.567 mln
9.91%
jan 1, 2003
1.002 bln
-2.298 bln
-69.63%
jan 1, 2006
0.0
-1.002 bln
-100.0%
jan 1, 2007
0.0
0.0
%
jan 1, 2008
230.0K
+230.0K
%
jan 1, 2009
0.0
-230.0K
-100.0%
jan 1, 2010
0.0
0.0
%
jan 1, 2011
2.339 bln
+2.339 bln
%
jan 1, 2012
0.0
-2.339 bln
-100.0%
jan 1, 2013
0.0
0.0
%
jan 1, 2014
0.0
0.0
%
jan 1, 2015
0.0
0.0
%
jan 1, 2016
0.0
0.0
%
Ranking of countries by current statistics by years