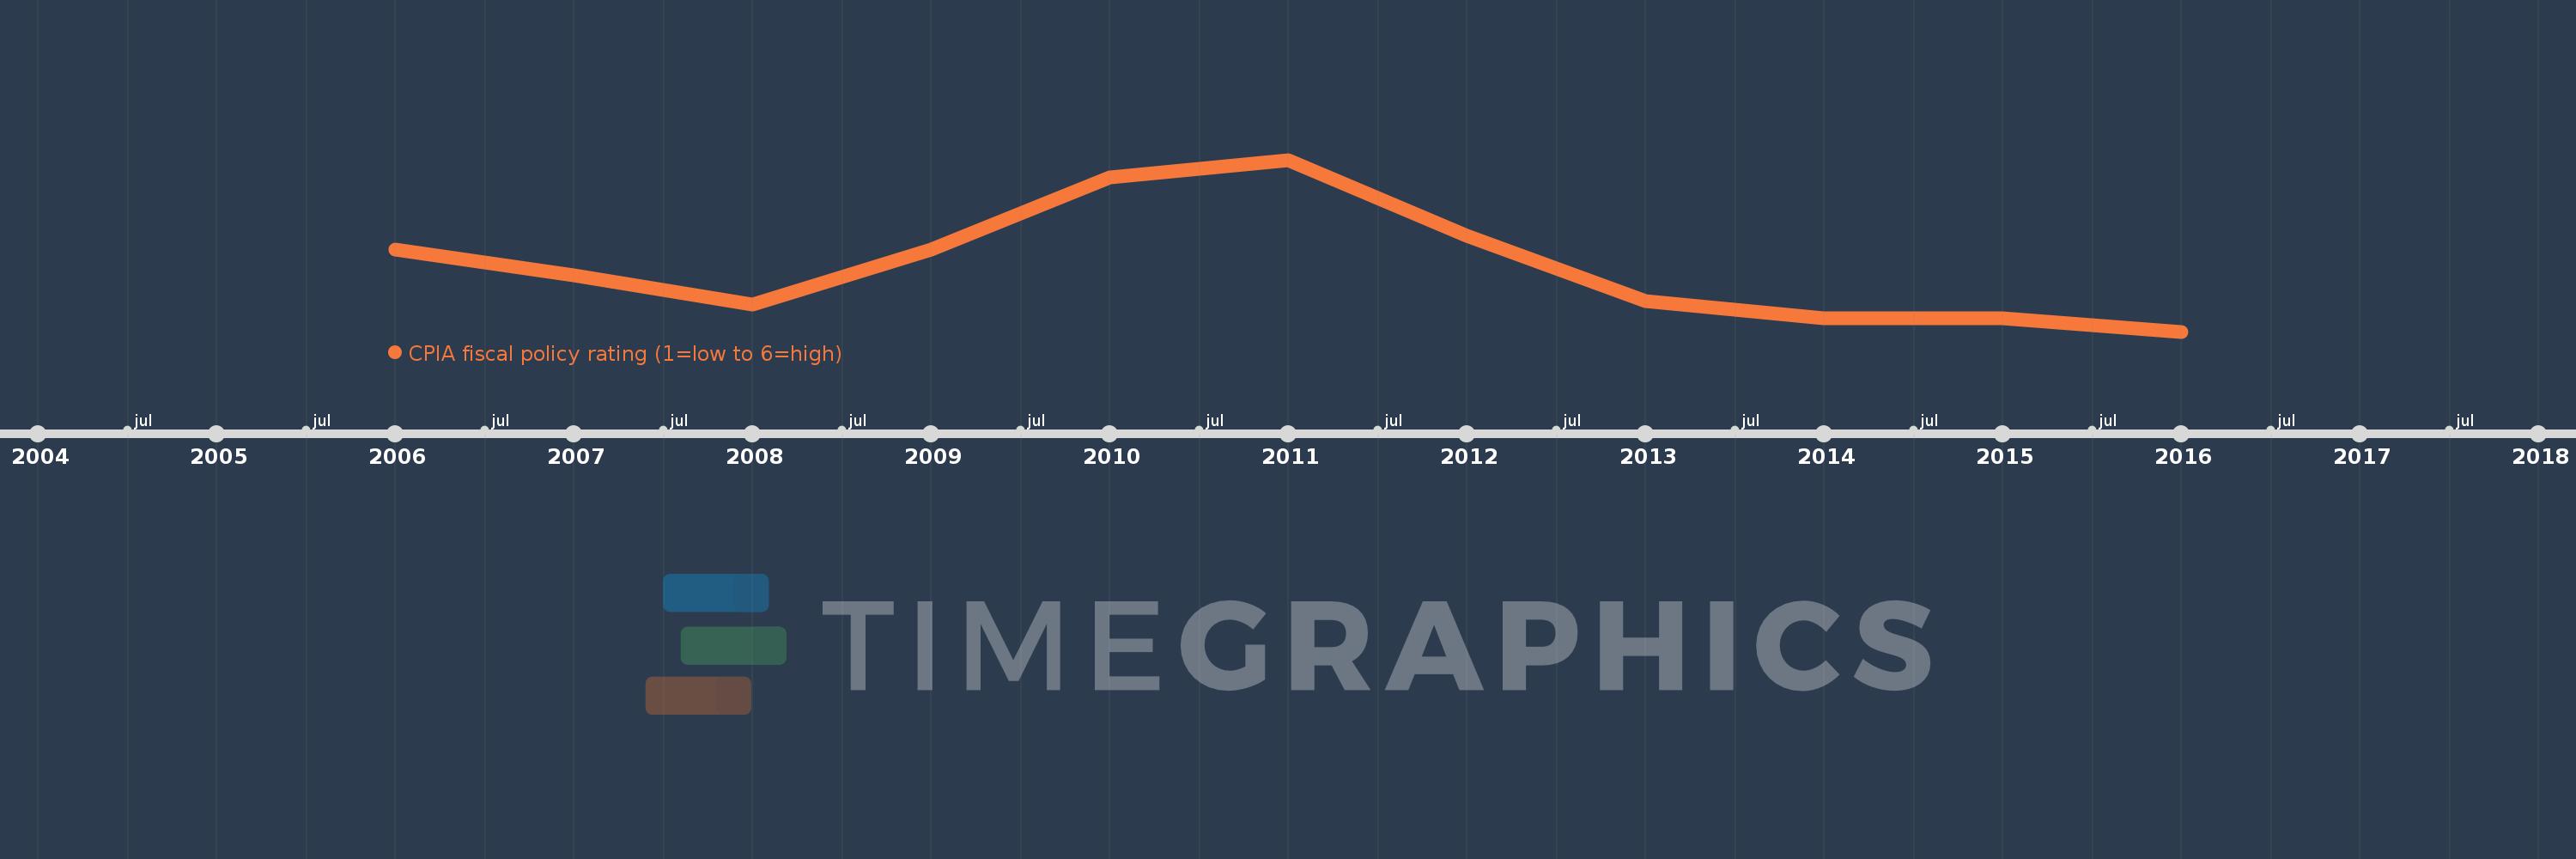
This timeline shows a graph from 2006 to 2016 of East Asia & Pacific (excluding high income). No data until 2005. Number of actual observations by date: 11.
Source name:
World Development Indicators
Source organization:
World Bank Group, CPIA database (http://www.worldbank.org/ida).
Categories, topics:
Public Sector
Last updated:
apr 23, 2017
Indicators value changes by year
Meaning:
3.233
Minimum:
3.067
jan 1, 2016
Maximum:
3.5
jan 1, 2011
At the date of observation
Value
Absolute change
Change from the previous value
jan 1, 2006
3.273
+3.273
0.0%
jan 1, 2007
3.208
-0.064
-1.97%
jan 1, 2008
3.136
-0.072
-2.24%
jan 1, 2009
3.273
+0.136
4.35%
jan 1, 2010
3.455
+0.182
5.56%
jan 1, 2011
3.5
+0.045
1.32%
jan 1, 2012
3.308
-0.192
-5.49%
jan 1, 2013
3.143
-0.165
-4.98%
jan 1, 2014
3.1
-0.043
-1.36%
jan 1, 2015
3.1
0.0
0.0%
jan 1, 2016
3.067
-0.033
-1.08%
Ranking of countries by current statistics by years