33
/
AIzaSyB4mHJ5NPEv-XzF7P6NDYXjlkCWaeKw5bc
November 30, 2025
274121
Ukraine
UKR
true
2
1
PPG, bonds (DIS, current US$)
2016,2015,2014,2013,2012,2011,2009,2008,2007,2006,2005,2003,1999
Create a timeline
Public Timelines
For education
For educational institutions
For teachers
For students
Cabinet
For educational institutions
For teachers
For students
Open cabinet
FAQ
Close
Create a timeline
Public timelines
FAQ
About & Feedback
Terms
Privacy
FAQ
Support 24/7
Cabinet
Get premium
Donate
Download
Global statistics library
→
Ukraine
→
PPG, bonds (DIS, current US$)
This statistics in other country:
Albania
Algeria
Angola
Argentina
Armenia
Azerbaijan
Belarus
Belize
Bolivia
Bosnia and Herzegovina
Botswana
Brazil
Bulgaria
Cameroon
China
Colombia
Congo, Dem. Rep.
Congo, Rep.
Costa Rica
Cote d'Ivoire
Dominica
Dominican Republic
East Asia & Pacific (excluding high income)
Ecuador
Egypt, Arab Rep.
El Salvador
Ethiopia
Europe & Central Asia (excluding high income)
Fiji
Gabon
Georgia
Ghana
Grenada
Guatemala
Guinea
Guyana
Honduras
IDA only
India
Indonesia
Jamaica
Jordan
Kazakhstan
Kenya
Lao PDR
Latin America & Caribbean (excluding high income)
Lebanon
Low & middle income
Low income
Lower middle income
Macedonia, FYR
Malaysia
Mauritius
Mexico
Middle East & North Africa (excluding high income)
Middle income
Moldova
Mongolia
Montenegro
Morocco
Mozambique
Nicaragua
Nigeria
Pakistan
Panama
Papua New Guinea
Paraguay
Peru
Philippines
Romania
Russian Federation
Rwanda
Samoa
Senegal
Serbia
South Africa
South Asia
Sri Lanka
St. Lucia
St. Vincent and the Grenadines
Sub-Saharan Africa (excluding high income)
Thailand
Tunisia
Turkey
Uganda
Ukraine
Upper middle income
Venezuela, RB
Vietnam
Zambia
Zimbabwe
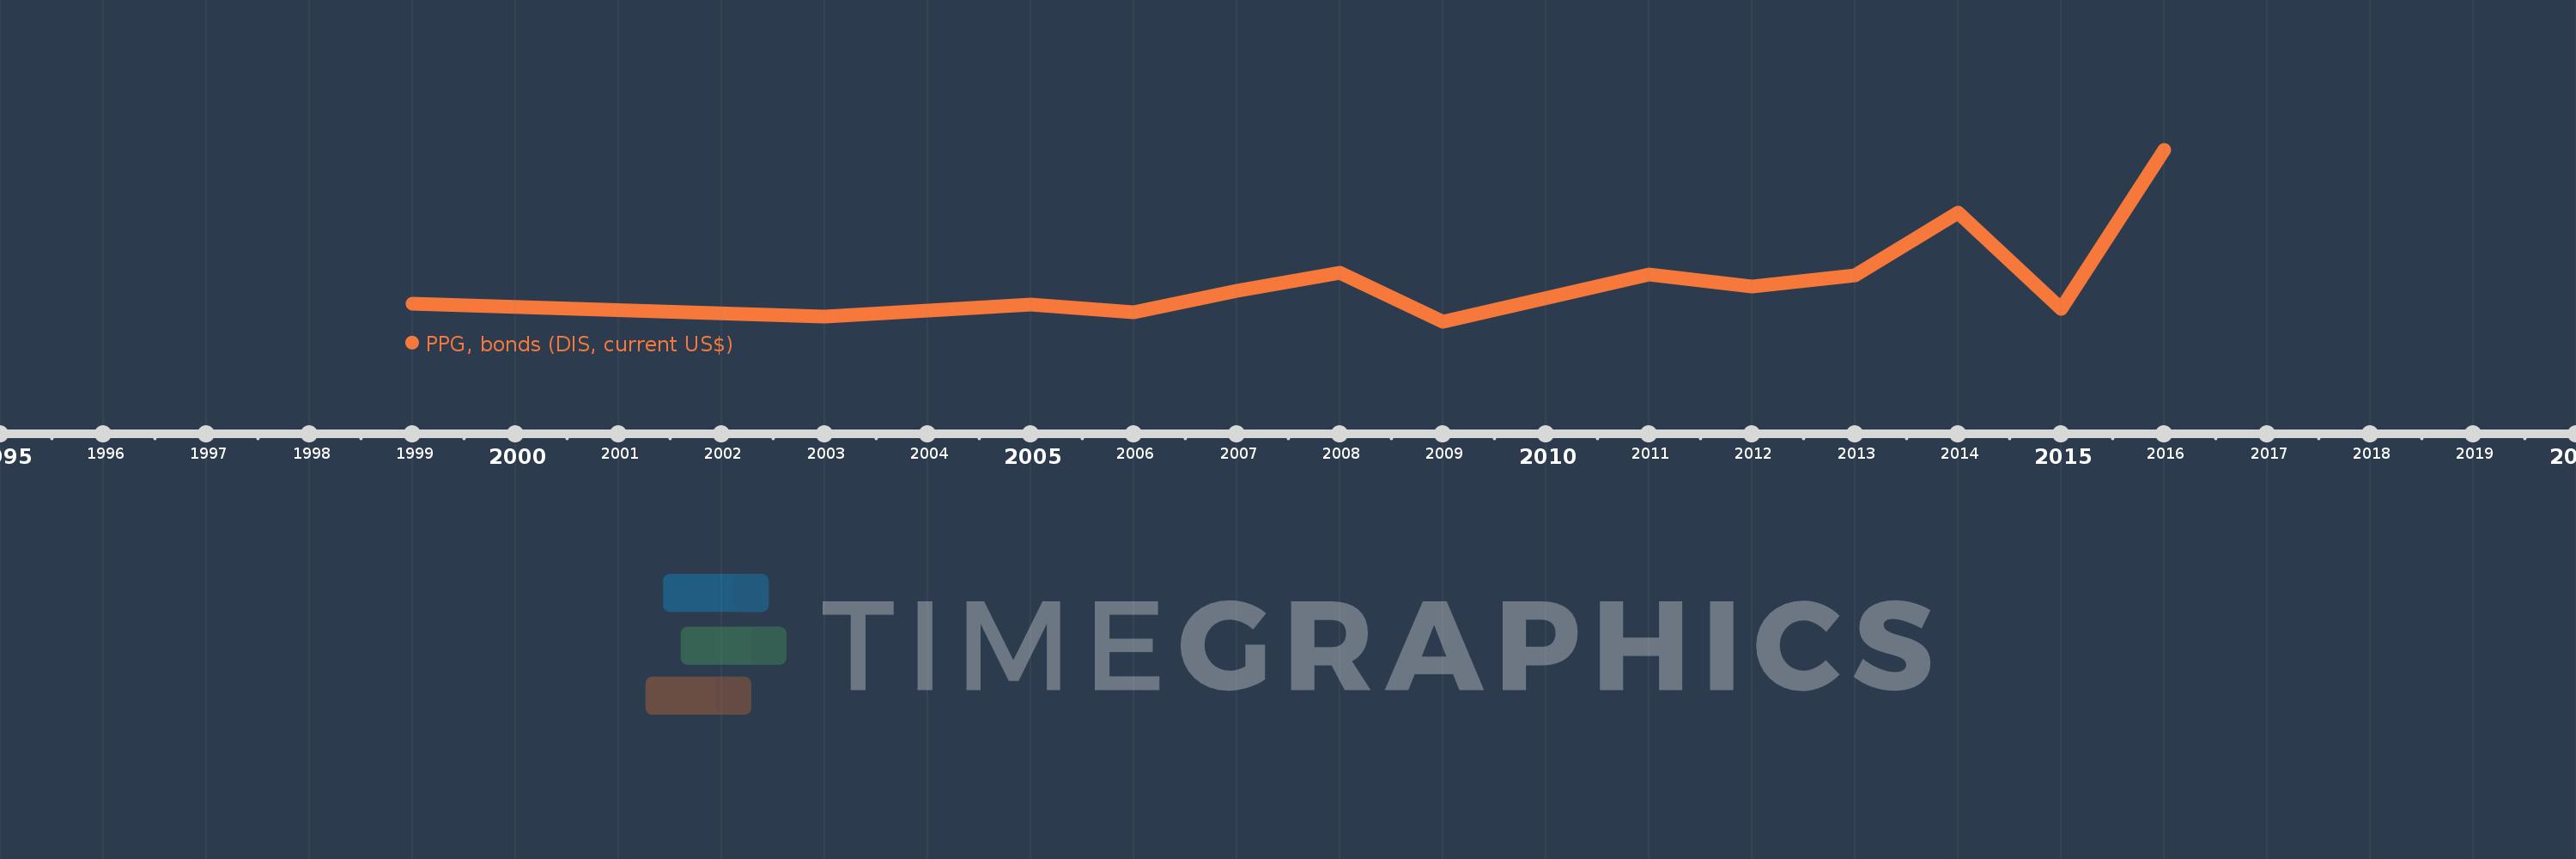
Timeline:
This timeline shows a graph from
1999
to
2016
of Ukraine. No data until
1998
. Number of actual observations by date:
13
.
Source name:
World Development Indicators
Source organization:
World Bank, International Debt Statistics.
Categories, topics:
External Debt
Last updated:
apr 23, 2017
Indicators value changes by year
Meaning:
3.3 bln
Minimum:
0.0
jan 1, 2009
Maximum:
13.302 bln
jan 1, 2016
At the date of observation
Value
Absolute change
Change from the previous value
jan 1, 1999
1.422 bln
+1.422 bln
0.0%
jan 1, 2003
399.0 mln
-1.023 bln
-71.95%
jan 1, 2005
1.357 bln
+958.5 mln
240.23%
jan 1, 2006
747.453 mln
-610.047 mln
-44.94%
jan 1, 2007
2.402 bln
+1.655 bln
221.37%
jan 1, 2008
3.786 bln
+1.384 bln
57.62%
jan 1, 2009
0.0
-3.786 bln
-100.0%
jan 1, 2011
3.685 bln
+3.685 bln
%
jan 1, 2012
2.75 bln
-935.088 mln
-25.37%
jan 1, 2013
3.6 bln
+850.0 mln
30.91%
jan 1, 2014
8.45 bln
+4.85 bln
134.72%
jan 1, 2015
1000.0 mln
-7.45 bln
-88.17%
jan 1, 2016
13.302 bln
+12.302 bln
1.23K%
Ranking of countries by current statistics by years
About & Feedback
Terms
Privacy
FAQ
Support 24/7
Cabinet
Get premium
Donate
The service accepts bank transfer (ACH, Wire) or cards (Visa, MasterCard, etc). Processed by Stripe.
Secured with SSL