33
/
AIzaSyAYiBZKx7MnpbEhh9jyipgxe19OcubqV5w
August 1, 2025
273099
Uganda
UGA
true
2
1
Unmet need for contraception (% of married women ages 15-49)
2015,2012,2007,2002,1996
Download
Global statistics library →Uganda →

Unmet need for contraception (% of married women ages 15-49)

This statistics in other country:

AlbaniaAlgeriaArab WorldArmeniaAzerbaijanBangladeshBarbadosBelarusBelgiumBelizeBeninBhutanBoliviaBosnia and HerzegovinaBrazilBulgariaBurkina FasoBurundiCabo VerdeCambodiaCameroonCaribbean small statesCentral African RepublicChadChinaColombiaComorosCongo, Dem. Rep.Congo, Rep.Costa RicaCote d'IvoireCubaCzech RepublicDominican RepublicEarly-demographic dividendEast Asia & PacificEast Asia & Pacific (excluding high income)East Asia & Pacific (IDA & IBRD countries)EcuadorEgypt, Arab Rep.El SalvadorEquatorial GuineaEritreaEthiopiaEurope & Central Asia (excluding high income)Europe & Central Asia (IDA & IBRD countries)Fragile and conflict affected situationsFranceGabonGambia, TheGeorgiaGhanaGuatemalaGuineaGuinea-BissauGuyanaHaitiHeavily indebted poor countries (HIPC)HondurasHungaryIBRD onlyIDA & IBRD totalIDA blendIDA onlyIDA totalIndiaIndonesiaIran, Islamic Rep.IraqItalyJamaicaJordanKazakhstanKenyaKiribatiKorea, Dem. People’s Rep.Kyrgyz RepublicLao PDRLate-demographic dividendLatviaLeast developed countries: UN classificationLesothoLiberiaLibyaLithuaniaLow & middle incomeLow incomeLower middle incomeMacedonia, FYRMadagascarMalawiMaldivesMaliMarshall IslandsMauritaniaMauritiusMexicoMiddle East & North AfricaMiddle East & North Africa (excluding high income)Middle East & North Africa (IDA & IBRD countries)Middle incomeMoldovaMongoliaMontenegroMoroccoMozambiqueMyanmarNamibiaNauruNepalNicaraguaNigerNigeriaNorth AmericaOmanPakistanPanamaPapua New GuineaParaguayPeruPhilippinesPre-demographic dividendPuerto RicoQatarRomaniaRussian FederationRwandaSamoaSao Tome and PrincipeSenegalSerbiaSierra LeoneSloveniaSolomon IslandsSouth AfricaSouth AsiaSouth Asia (IDA & IBRD)South SudanSpainSri LankaSt. LuciaSub-Saharan Africa Sub-Saharan Africa (excluding high income)Sub-Saharan Africa (IDA & IBRD countries)SudanSurinameSwazilandSyrian Arab RepublicTajikistanTanzaniaThailandTimor-LesteTogoTongaTunisiaTurkeyTurkmenistanTuvaluUgandaUkraineUnited StatesUpper middle incomeUzbekistanVanuatuVenezuela, RBVietnamWest Bank and GazaYemen, Rep.ZambiaZimbabwe

Timeline:

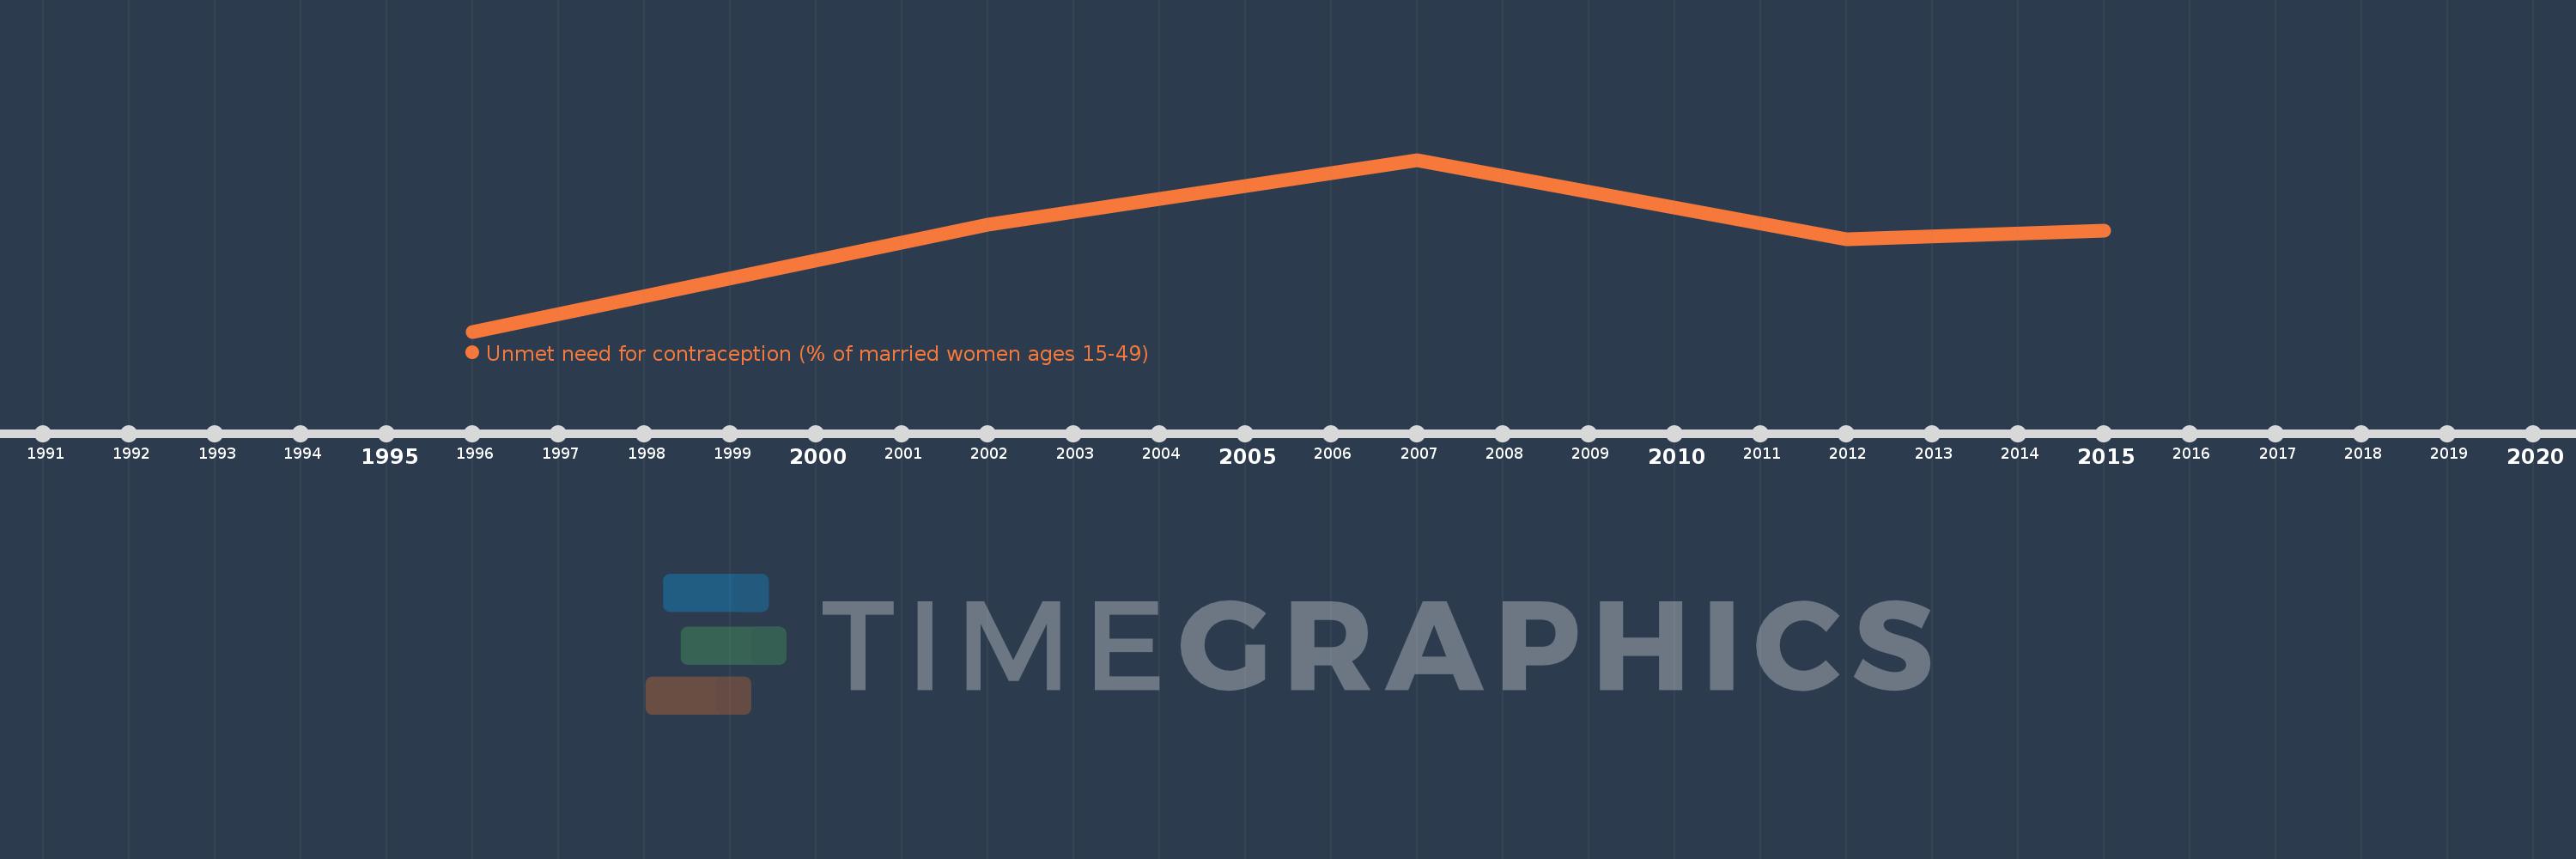
This timeline shows a graph from 1996 to 2015 of Uganda. No data until 1995. Number of actual observations by date: 5.

Source name:

World Development Indicators

Source organization:

Household surveys, including Demographic and Health Surveys and Multiple Indicator Cluster Surveys. Largely compiled by United Nations Population Division.

Categories, topics:

Health

Last updated:

apr 23, 2017

Indicators value changes by year

Meaning:
34.4
Minimum:
30.0
jan 1, 1996
Maximum:
38.0
jan 1, 2007
At the date of observation
Value
Absolute change
Change from the previous value
jan 1, 1996
30.0
+30.0
0.0%
jan 1, 2002
35.0
+5.0
16.67%
jan 1, 2007
38.0
+3.0
8.57%
jan 1, 2012
34.3
-3.7
-9.74%
jan 1, 2015
34.7
+0.4
1.17%

Ranking of countries by current statistics by years