29
/
en
AIzaSyAYiBZKx7MnpbEhh9jyipgxe19OcubqV5w
April 1, 2024
27178
East Asia & Pacific
EAS
false
2
1
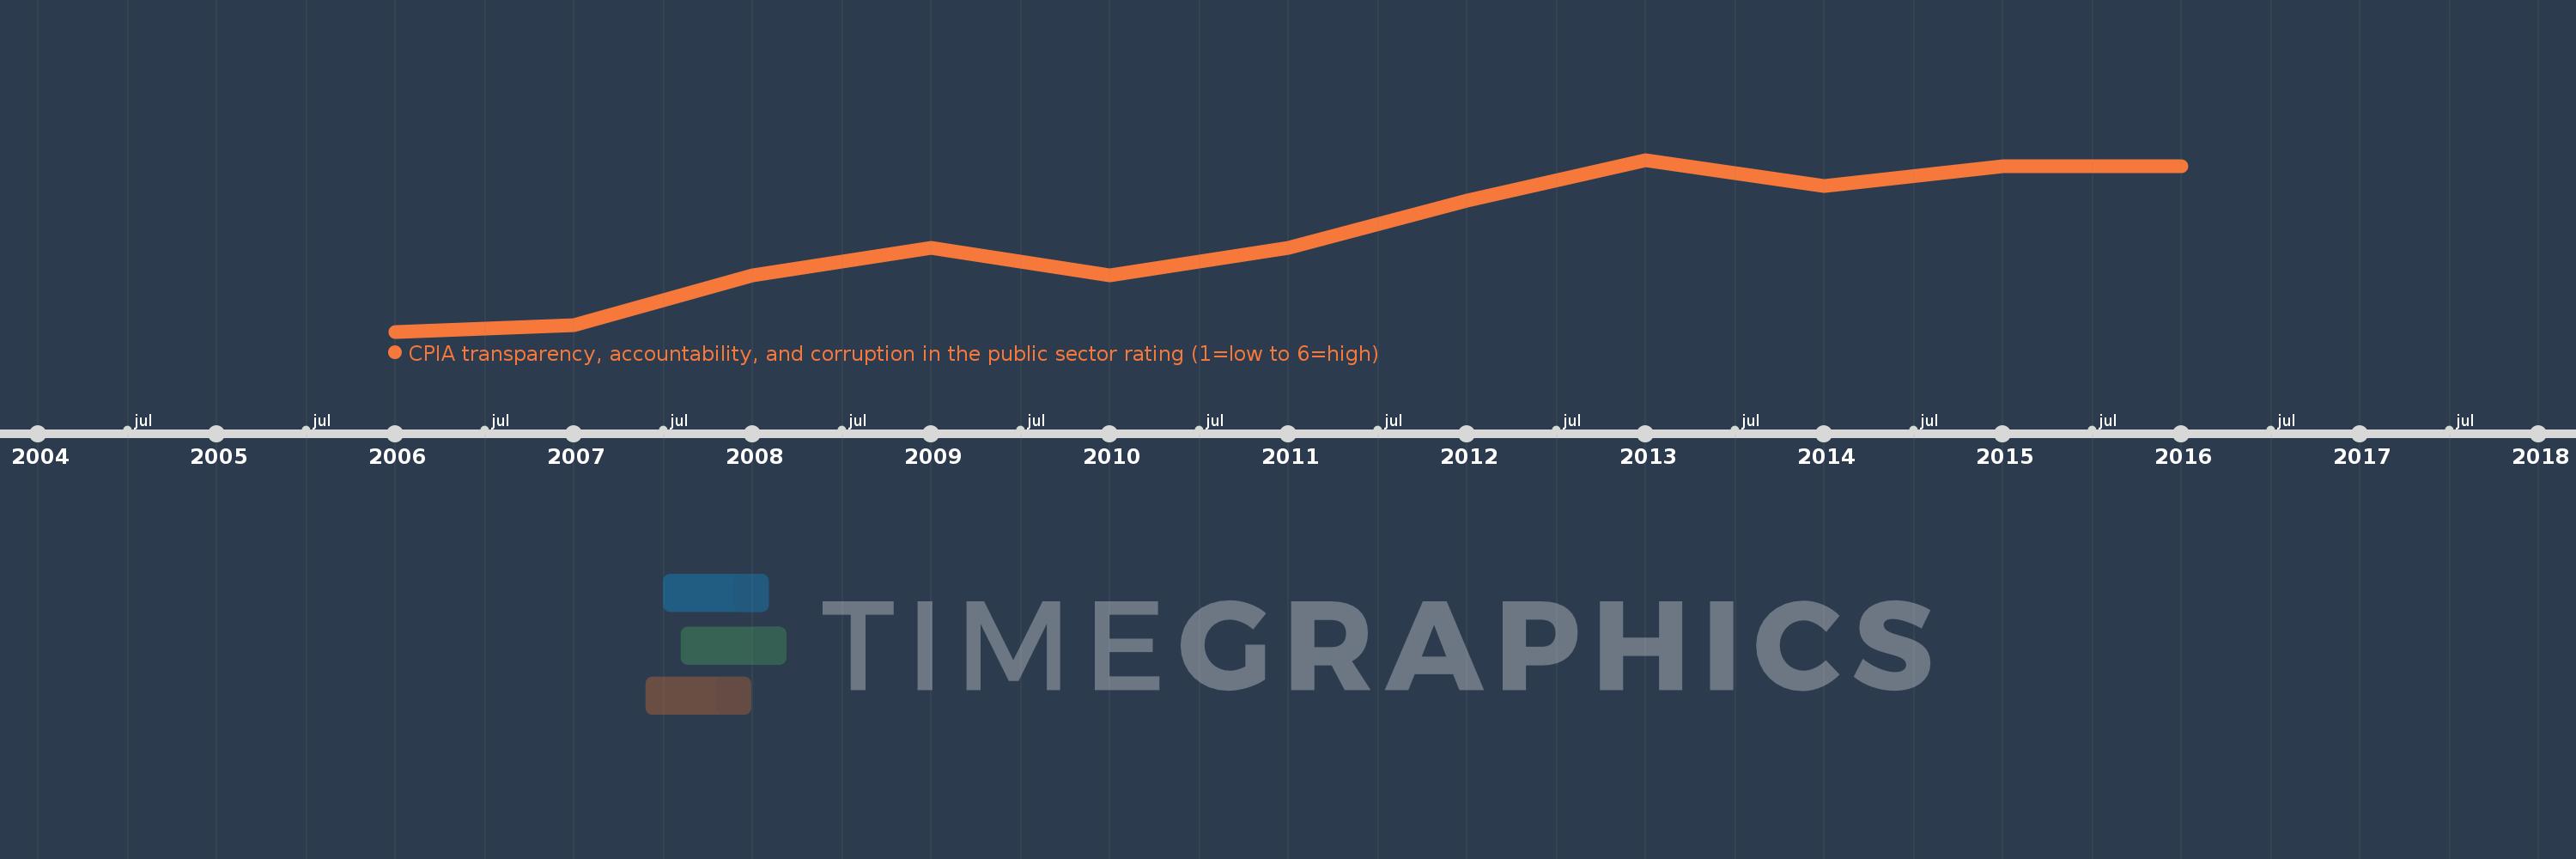
CPIA transparency, accountability, and corruption in the public sector rating (1=low to 6=high)
2016,2015,2014,2013,2012,2011,2010,2009,2008,2007,2006
This statistics in other country:
Timeline:
This timeline shows a graph from 2006 to 2016 of East Asia & Pacific. No data until 2005. Number of actual observations by date: 11.
Source name:
World Development Indicators
Source organization:
World Bank Group, CPIA database (http://www.worldbank.org/ida).
Categories, topics:
Public Sector
Last updated:
apr 23, 2017
Indicators value changes by year
At the date of observation
Value
Absolute change
Change from previous value
jan 1, 2006
2.864
+2.864
0.0%
jan 1, 2007
2.875
+0.011
0.4%
jan 1, 2008
2.955
+0.08
2.77%
jan 1, 2009
3.0
+0.045
1.54%
jan 1, 2010
2.955
-0.045
-1.52%
jan 1, 2011
3.0
+0.045
1.54%
jan 1, 2012
3.077
+0.077
2.56%
jan 1, 2013
3.143
+0.066
2.14%
jan 1, 2014
3.1
-0.043
-1.36%
jan 1, 2015
3.133
+0.033
1.08%
jan 1, 2016
3.133
0.0
0.0%
Ranking of countries by current statistics by years
Comments: