33
/
AIzaSyB4mHJ5NPEv-XzF7P6NDYXjlkCWaeKw5bc
November 30, 2025
271133
Turks and Caicos Islands
TCA
true
2
1
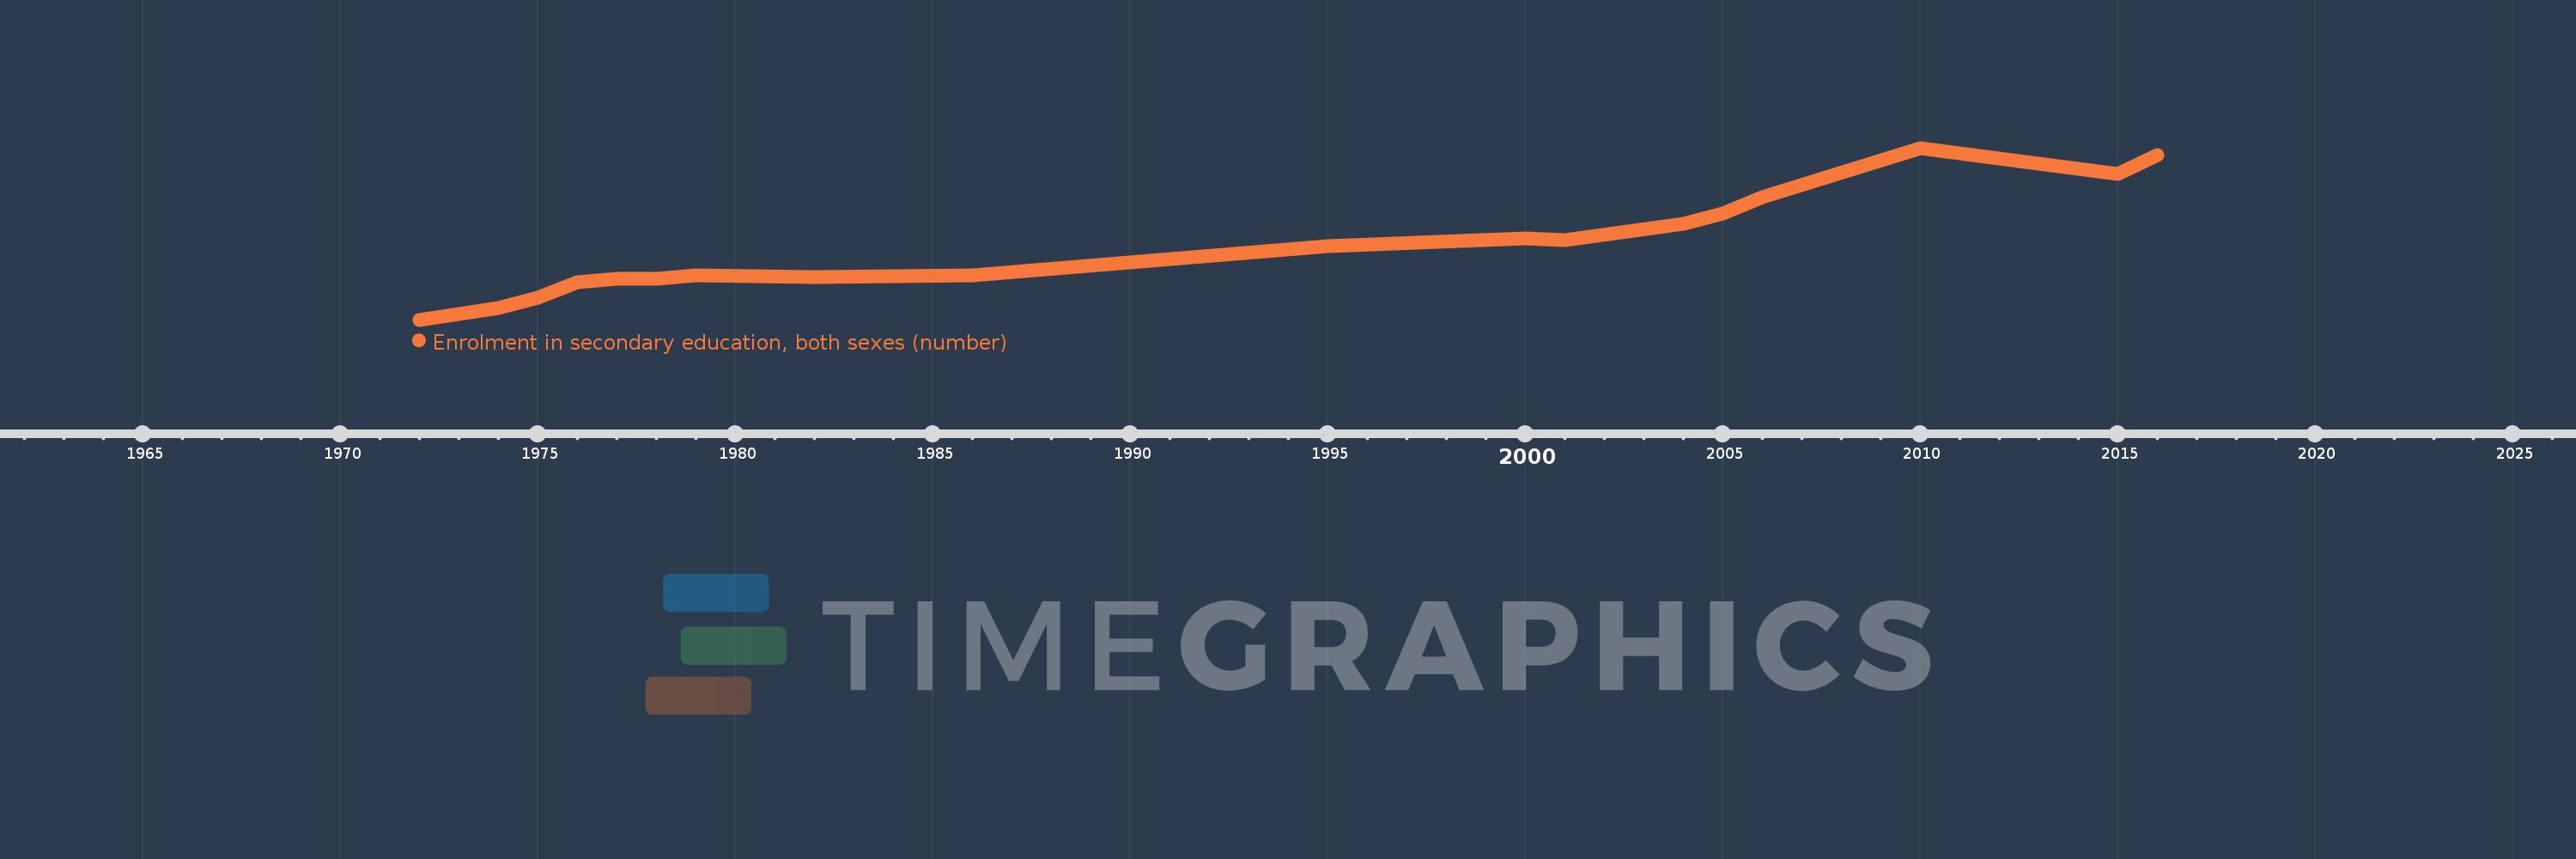
Enrolment in secondary education, both sexes (number)
2016,2015,2010,2006,2005,2004,2001,2000,1995,1986,1982,1979,1978,1977,1976,1975,1974,1972