Download This statistics in other country:
Timeline:
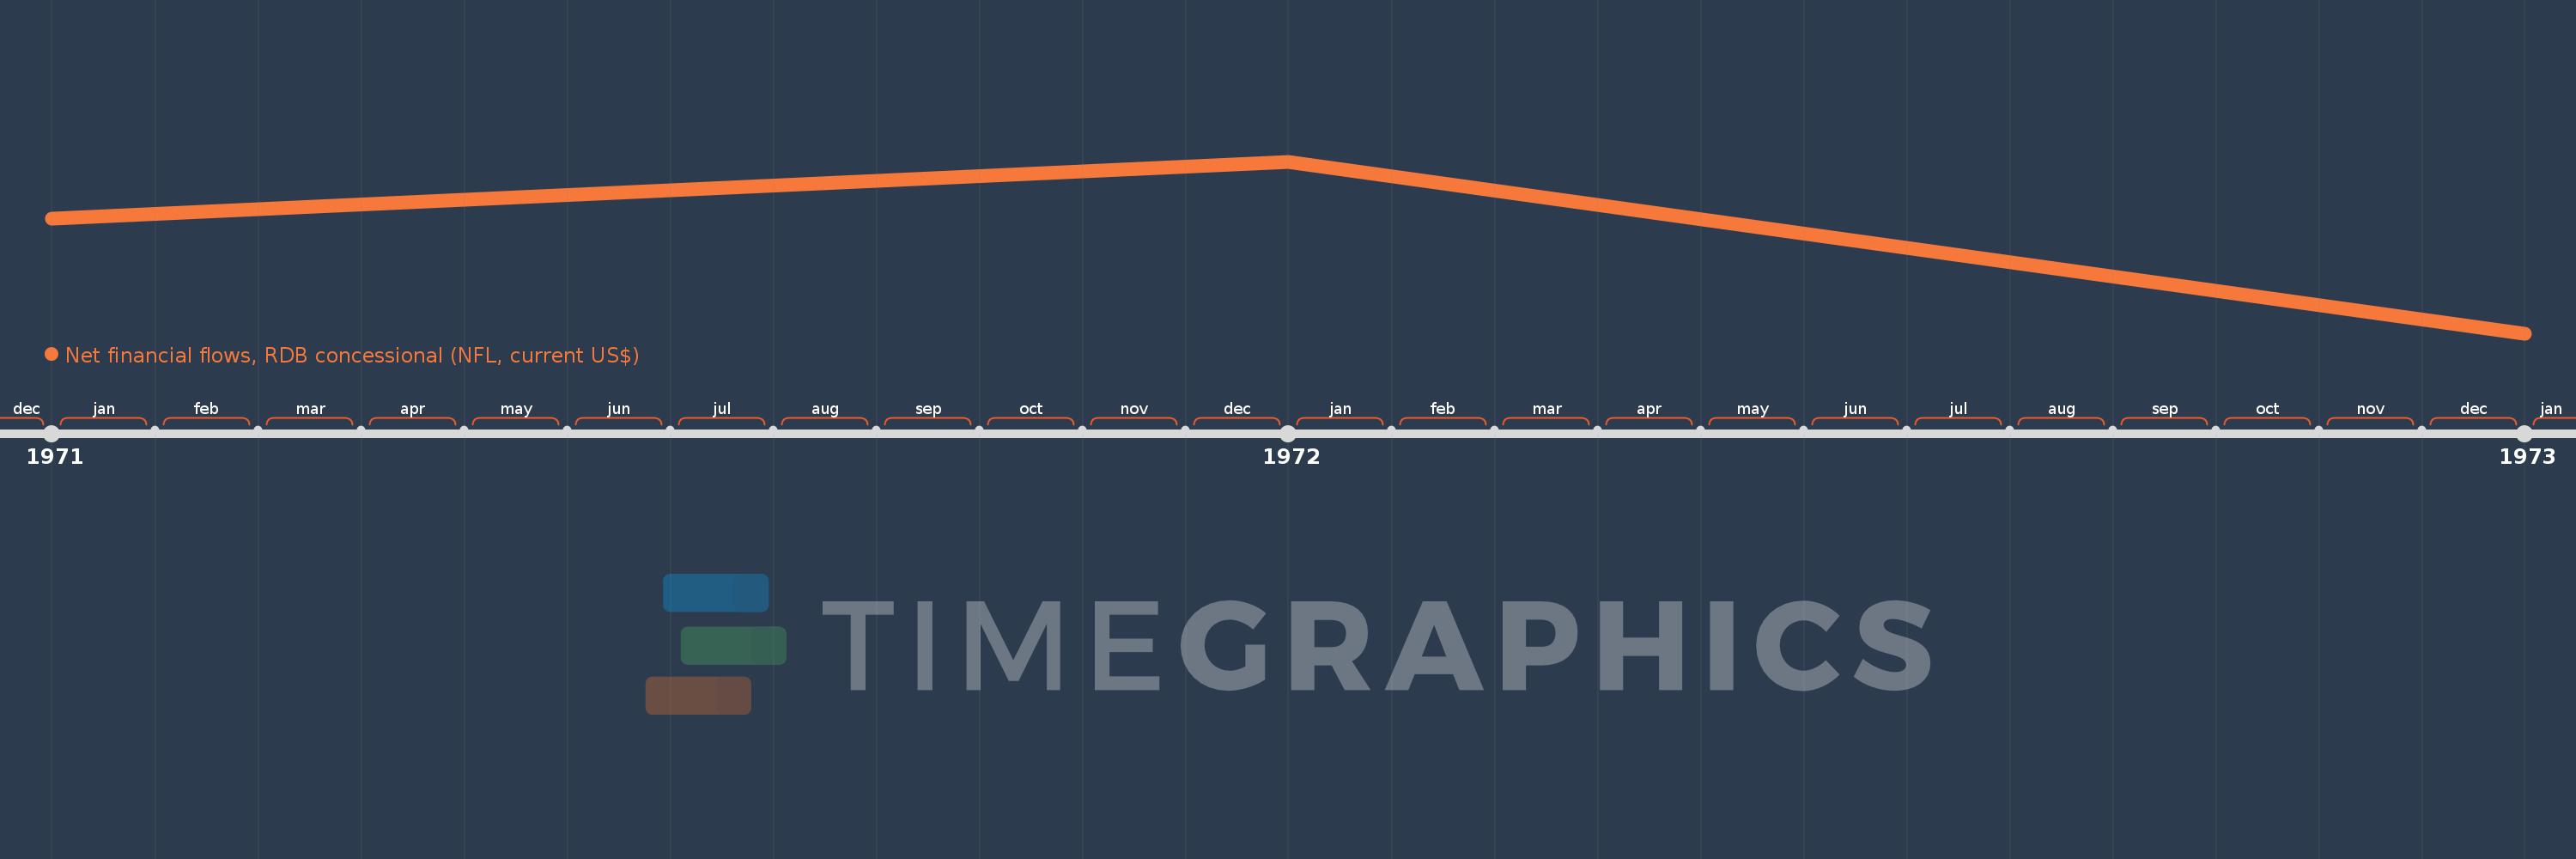
This timeline shows a graph from 1971 to 1973 of Turkey. No data until 1970. Number of actual observations by date: 3.
Source name:
World Development Indicators
Source organization:
World Bank, International Debt Statistics.
Categories, topics:
External Debt
Last updated:
apr 23, 2017
Indicators value changes by year
Minimum:
-52.04 mln
jan 1, 1973
Maximum:
316.0K
jan 1, 1972
At the date of observation
Value
Absolute change
Change from the previous value
jan 1, 1971
-17.089 mln
-17.089 mln
0.0%
jan 1, 1972
316.0K
+17.405 mln
-101.85%
jan 1, 1973
-52.04 mln
-52.356 mln
-16.57K%
Ranking of countries by current statistics by years