Download This statistics in other country:
Timeline:
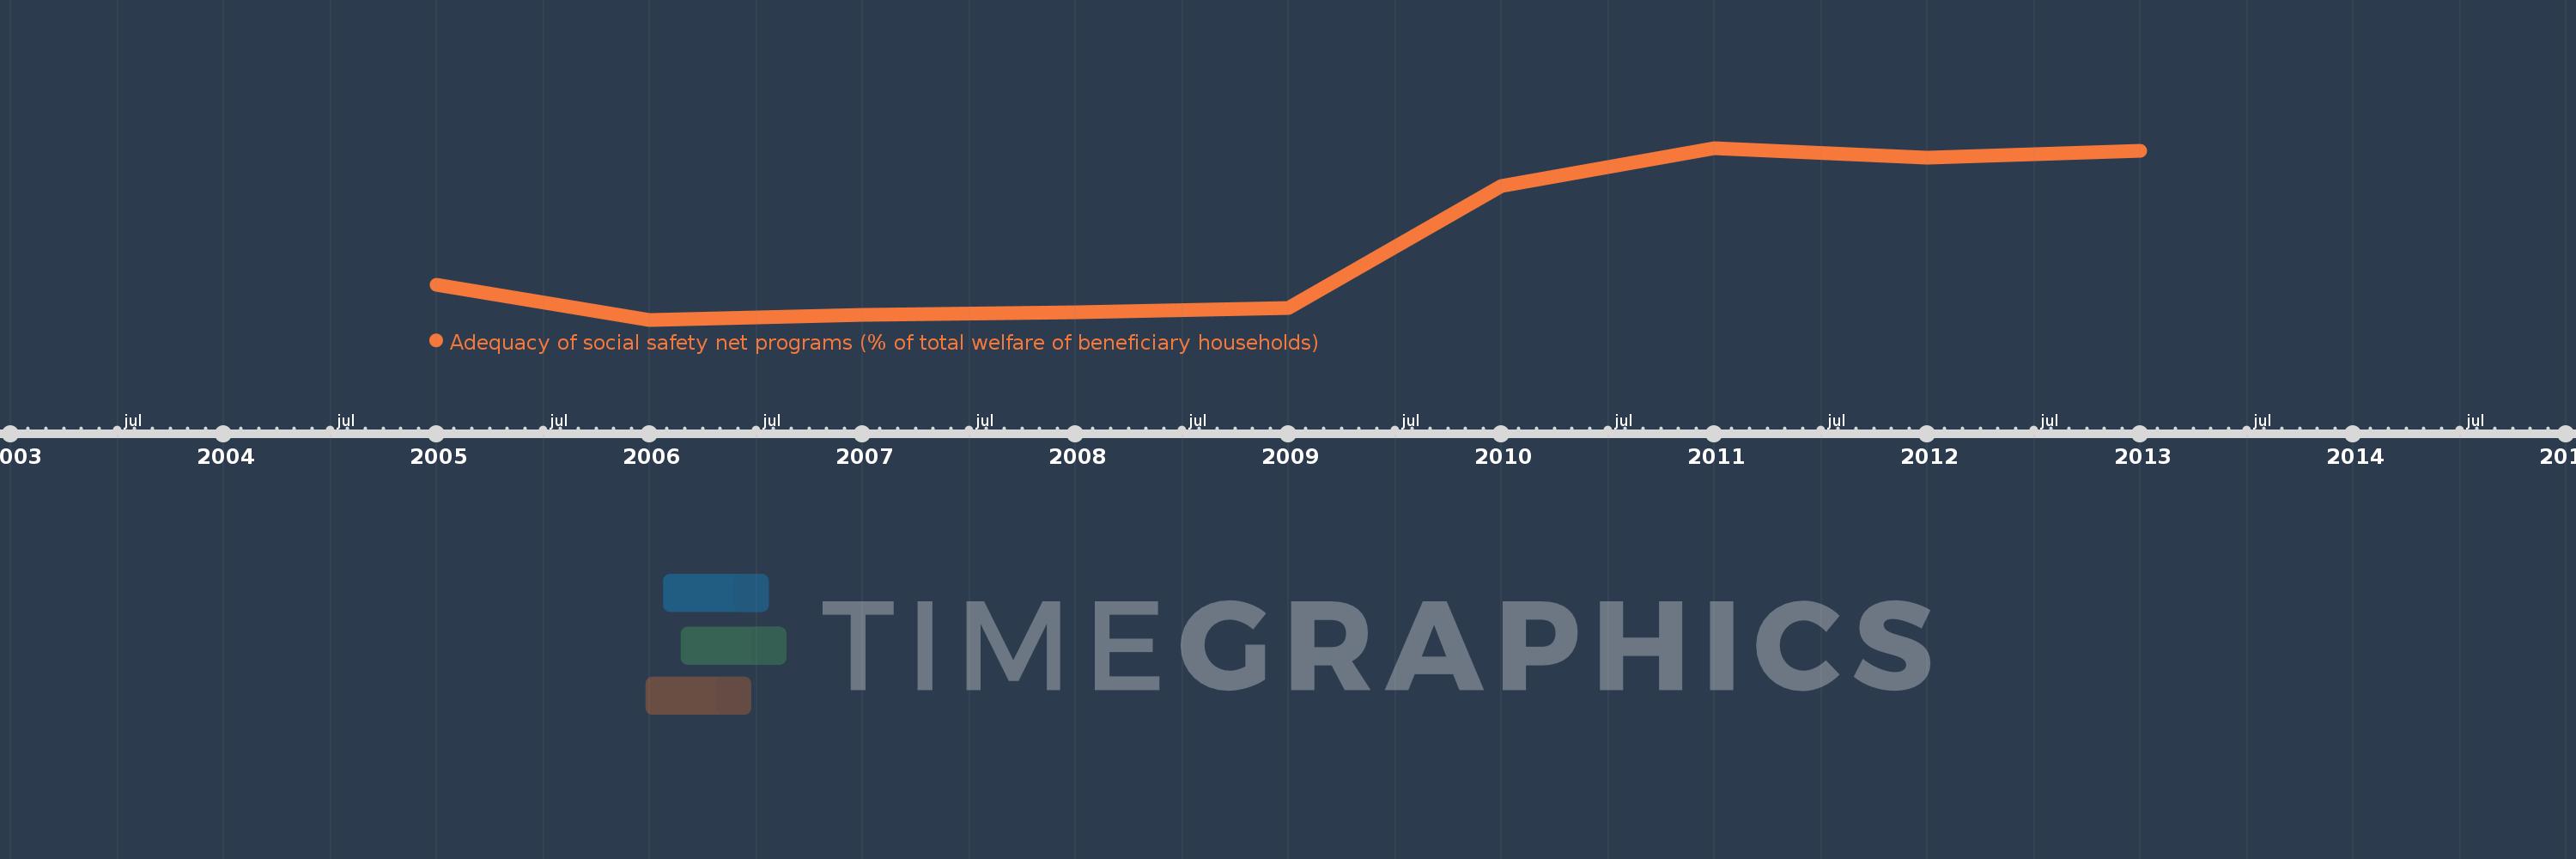
This timeline shows a graph from 2005 to 2013 of Turkey. No data until 2004. Number of actual observations by date: 9.
Source name:
World Development Indicators
Source organization:
The Atlas of Social Protection: Indicators of Resilience and Equity (ASPIRE)
Categories, topics:
Social Protection & Labor
Last updated:
apr 23, 2017
Indicators value changes by year
At the date of observation
Value
Absolute change
Change from the previous value
jan 1, 2005
2.746
+2.746
0.0%
jan 1, 2006
1.47
-1.276
-46.46%
jan 1, 2007
1.647
+0.176
11.98%
jan 1, 2008
1.743
+0.096
5.86%
jan 1, 2009
1.915
+0.172
9.86%
jan 1, 2010
6.367
+4.452
232.51%
jan 1, 2011
7.764
+1.397
21.95%
jan 1, 2012
7.421
-0.343
-4.42%
jan 1, 2013
7.652
+0.23
3.1%
Ranking of countries by current statistics by years