33
/
AIzaSyB4mHJ5NPEv-XzF7P6NDYXjlkCWaeKw5bc
November 30, 2025
267729
Tunisia
TUN
true
2
1
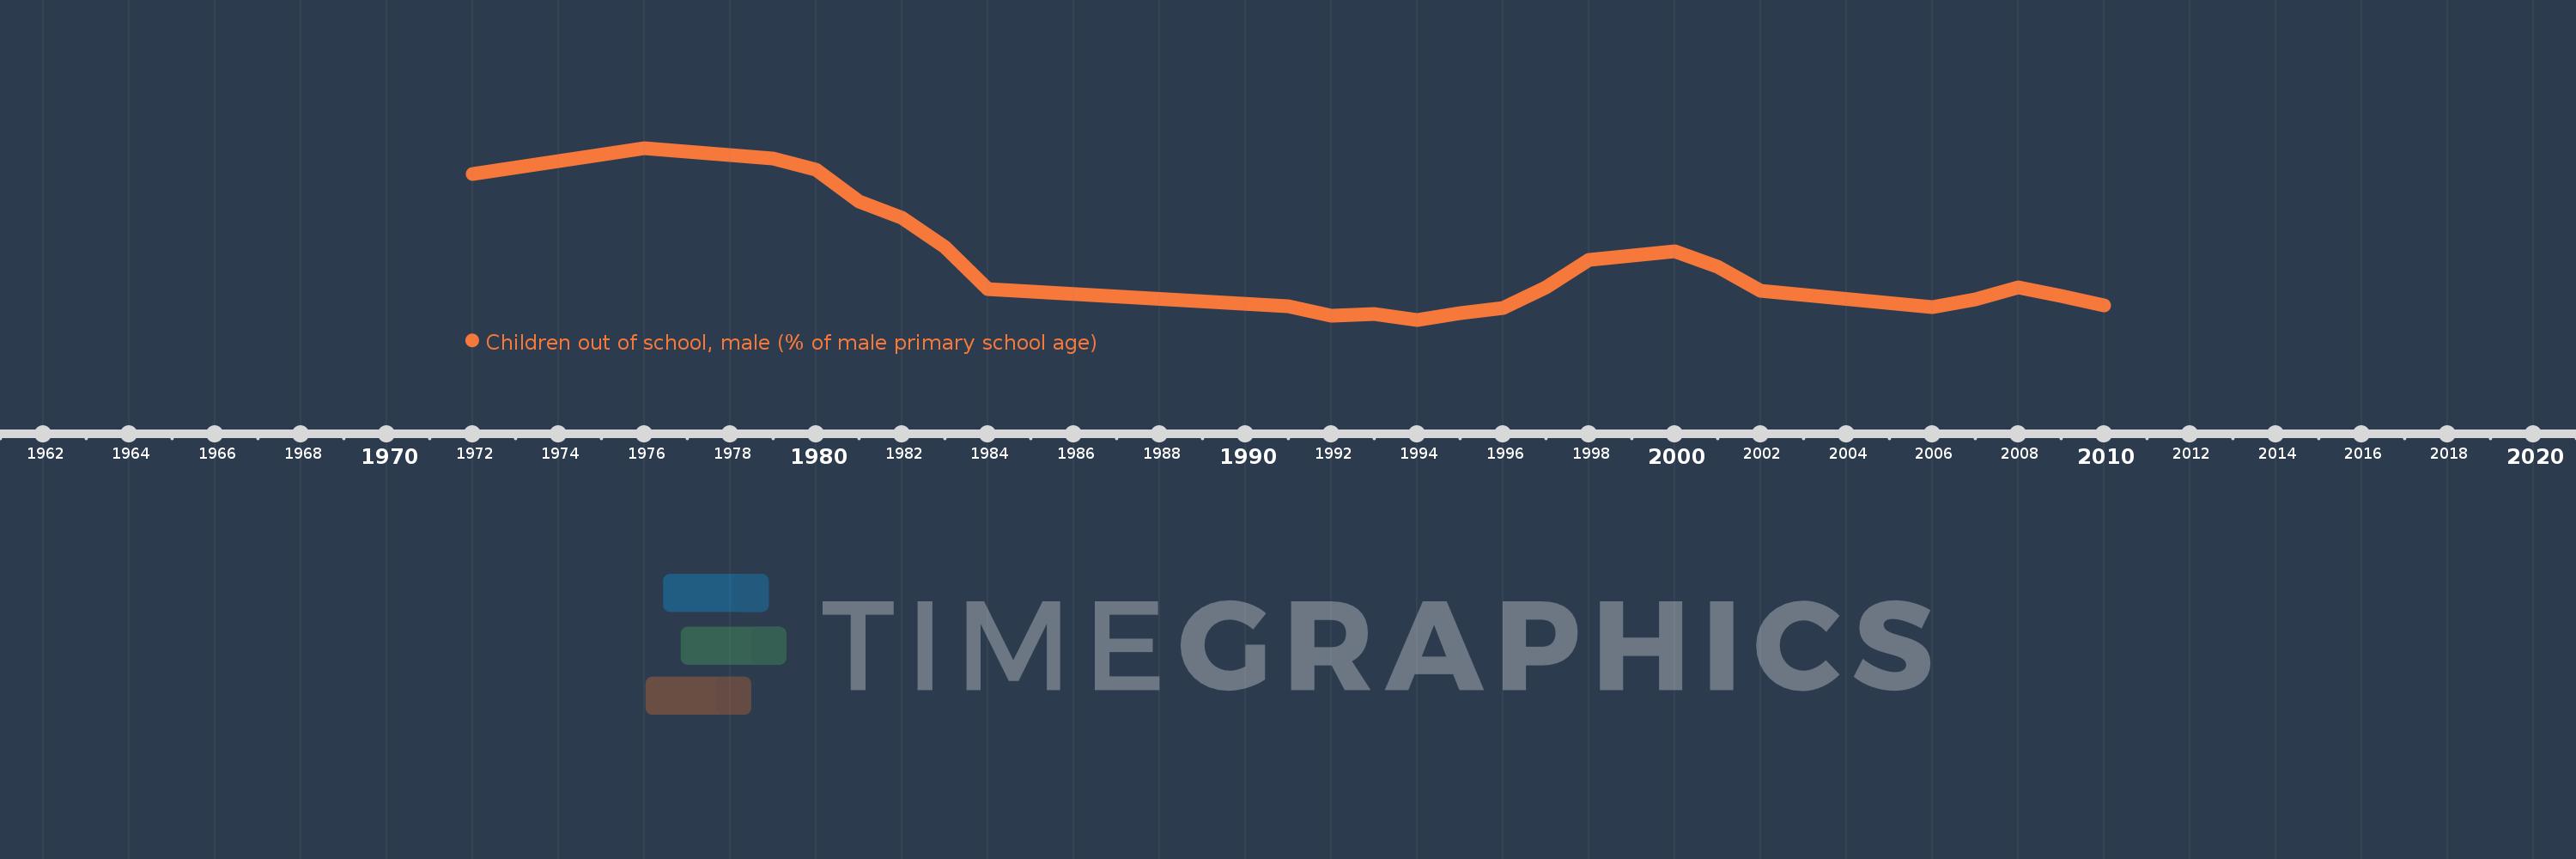
Children out of school, male (% of male primary school age)
2010,2009,2008,2007,2006,2002,2001,2000,1998,1997,1996,1995,1994,1993,1992,1991,1984,1983,1982,1981,1980,1979,1976,1972