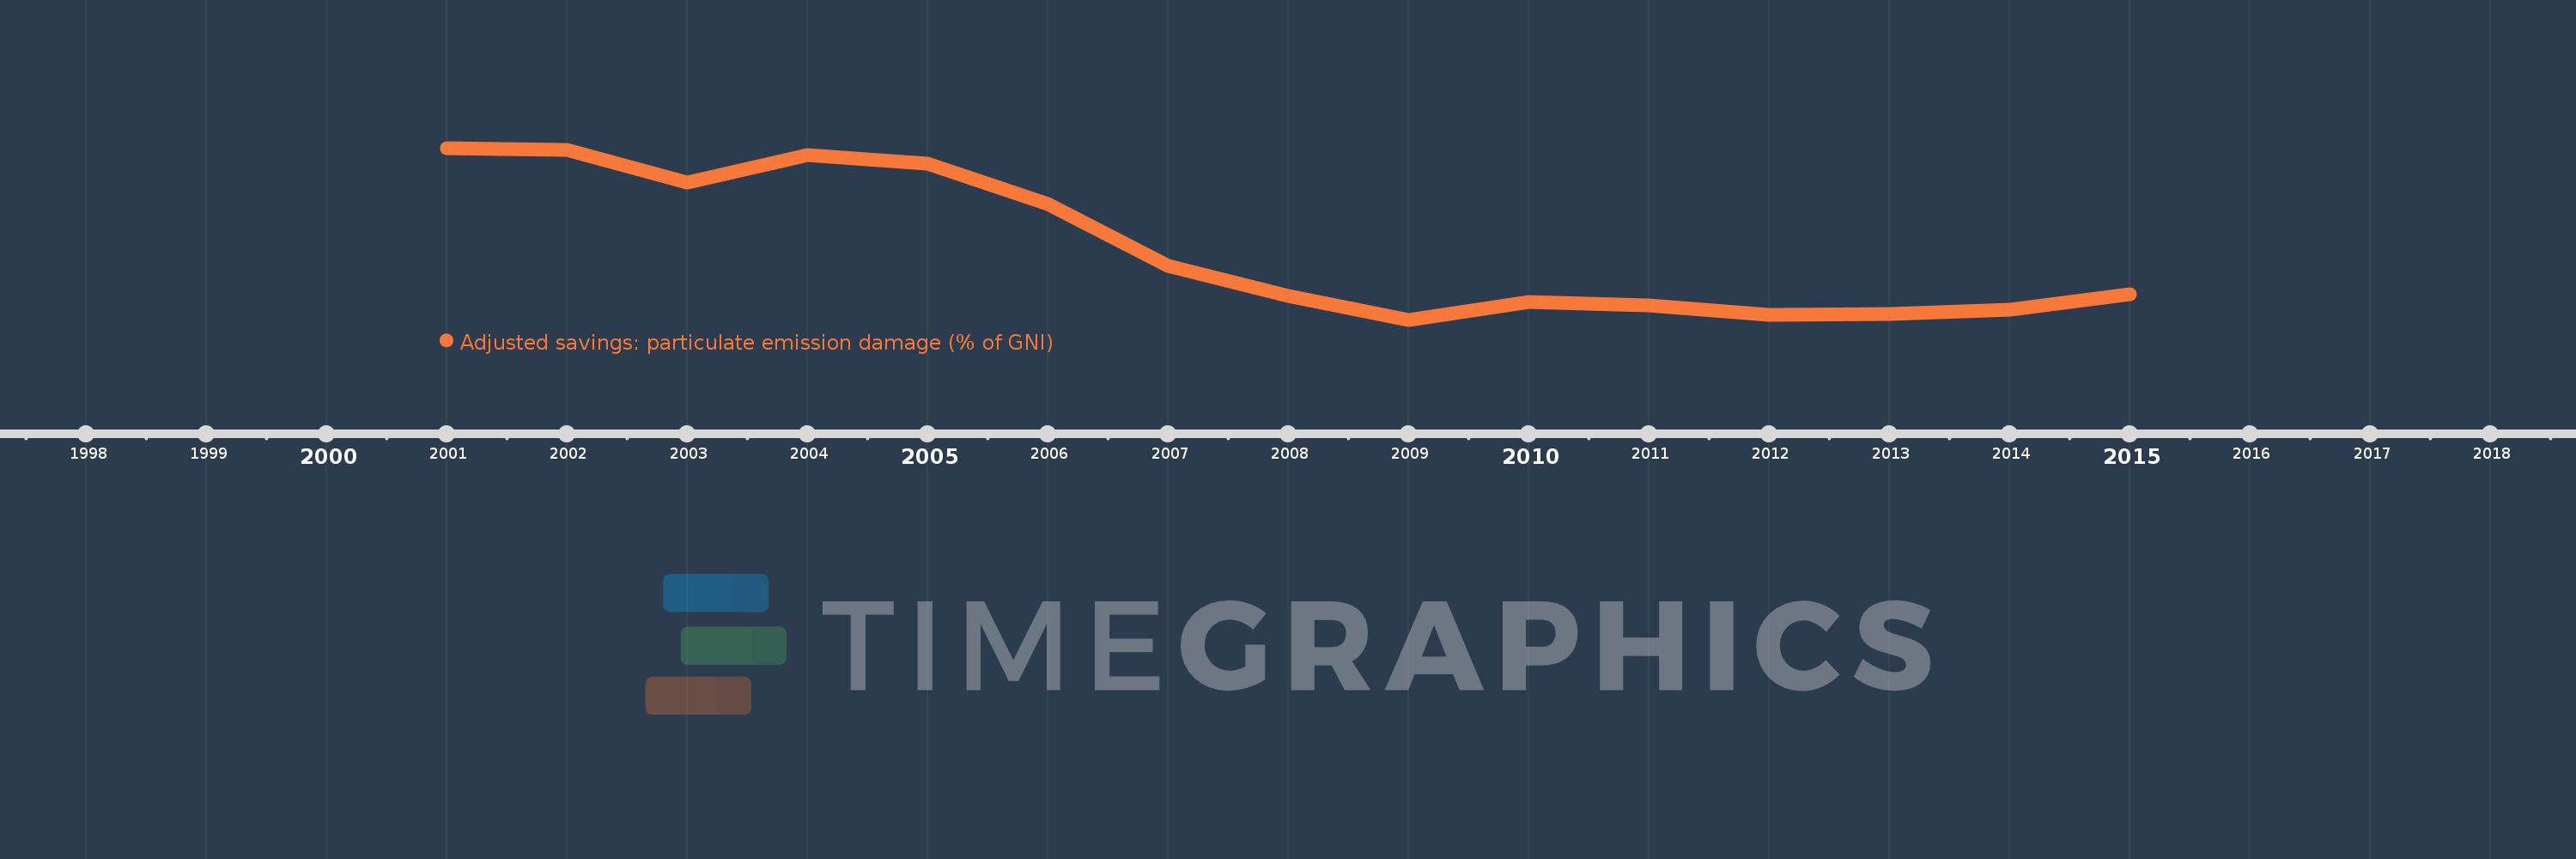
This timeline shows a graph from 2001 to 2015 of Timor-Leste. No data until 2000. Number of actual observations by date: 15.
Source name:
World Development Indicators
Source organization:
Data on health impacts from exposure to ambient PM2.5 pollution and household air pollution are from the Global Burden of Disease 2010 study. Data are provided by the Institute for Health Metrics and Evaluation at the University of Washington.
Categories, topics:
Economy & Growth, Environment
Last updated:
apr 23, 2017
Indicators value changes by year
Meaning:
0.634
Minimum:
0.244
jan 1, 2009
Maximum:
1.182
jan 1, 2001
At the date of observation
Value
Absolute change
Change from the previous value
jan 1, 2001
1.182
+1.182
0.0%
jan 1, 2002
1.17
-0.012
-1.04%
jan 1, 2003
0.994
-0.175
-14.97%
jan 1, 2004
1.145
+0.151
15.14%
jan 1, 2005
1.095
-0.05
-4.33%
jan 1, 2006
0.874
-0.222
-20.26%
jan 1, 2007
0.538
-0.336
-38.46%
jan 1, 2008
0.374
-0.163
-30.37%
jan 1, 2009
0.244
-0.13
-34.75%
jan 1, 2010
0.342
+0.097
39.86%
jan 1, 2011
0.321
-0.021
-6.13%
jan 1, 2012
0.271
-0.049
-15.4%
jan 1, 2013
0.274
+0.003
1.16%
jan 1, 2014
0.3
+0.025
9.26%
jan 1, 2015
0.383
+0.084
27.87%
Ranking of countries by current statistics by years