Download This statistics in other country:
Timeline:
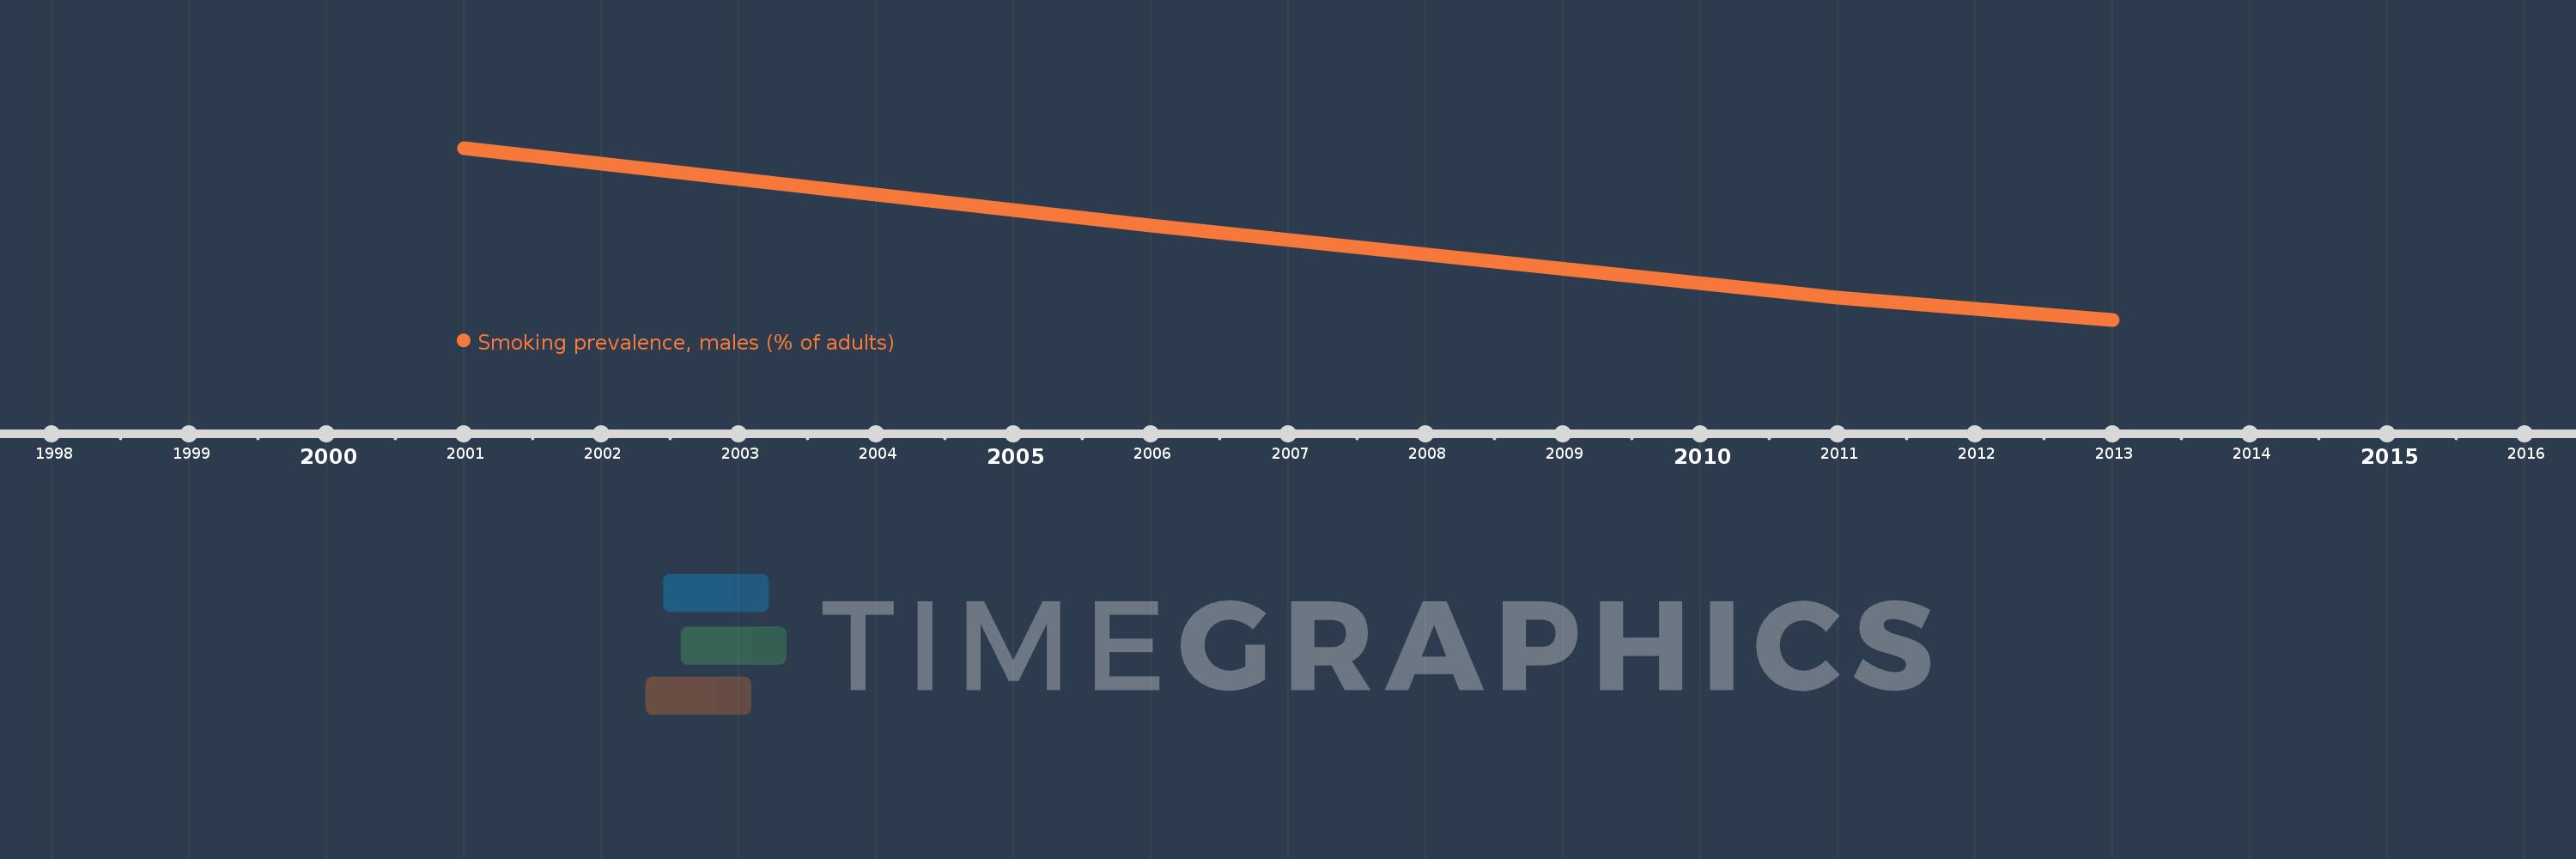
This timeline shows a graph from 2001 to 2013 of Tanzania. No data until 2000. Number of actual observations by date: 4.
Source name:
World Development Indicators
Source organization:
World Health Organization, Global Health Observatory Data Repository (http://apps.who.int/ghodata/).
Categories, topics:
Health, Gender
Last updated:
apr 23, 2017
Indicators value changes by year
At the date of observation
Value
Absolute change
Change from the previous value
jan 1, 2001
37.6
+37.6
0.0%
jan 1, 2006
33.8
-3.8
-10.11%
jan 1, 2011
30.3
-3.5
-10.36%
jan 1, 2013
29.2
-1.1
-3.63%
Ranking of countries by current statistics by years