33
/
AIzaSyB4mHJ5NPEv-XzF7P6NDYXjlkCWaeKw5bc
November 30, 2025
260061
Tajikistan
TJK
true
2
1
PNG, commercial banks and other creditors (INT, current US$)
2016,2015,2014,2013,2012,2011,2010,2009,2008,2007,2006,2005,2004,2003,2002,2001,2000,1999,1998
Create a timeline
Public Timelines
For education
For educational institutions
For teachers
For students
Cabinet
For educational institutions
For teachers
For students
Open cabinet
FAQ
Close
Create a timeline
Public timelines
FAQ
About & Feedback
Terms
Privacy
FAQ
Support 24/7
Cabinet
Get premium
Donate
Download
Global statistics library
→
Tajikistan
→
PNG, commercial banks and other creditors (INT, current US$)
This statistics in other country:
Albania
Algeria
Argentina
Armenia
Azerbaijan
Bangladesh
Belarus
Belize
Bhutan
Bolivia
Bosnia and Herzegovina
Brazil
Bulgaria
Cambodia
Cameroon
China
Colombia
Costa Rica
Cote d'Ivoire
Dominican Republic
East Asia & Pacific (excluding high income)
Ecuador
Egypt, Arab Rep.
El Salvador
Europe & Central Asia (excluding high income)
Fiji
Georgia
Ghana
Guatemala
Guyana
Haiti
Honduras
IDA only
India
Indonesia
Jamaica
Jordan
Kazakhstan
Kenya
Kosovo
Kyrgyz Republic
Lao PDR
Latin America & Caribbean (excluding high income)
Low & middle income
Low income
Lower middle income
Macedonia, FYR
Madagascar
Malawi
Malaysia
Maldives
Mauritius
Mexico
Middle East & North Africa (excluding high income)
Middle income
Moldova
Mongolia
Montenegro
Morocco
Myanmar
Nicaragua
Niger
Nigeria
Pakistan
Panama
Papua New Guinea
Paraguay
Peru
Philippines
Romania
Russian Federation
Senegal
Serbia
Solomon Islands
South Africa
South Asia
Sri Lanka
Sub-Saharan Africa (excluding high income)
Tajikistan
Tanzania
Thailand
Tunisia
Turkey
Turkmenistan
Ukraine
Upper middle income
Uzbekistan
Venezuela, RB
Vietnam
Zambia
Zimbabwe
Timeline:
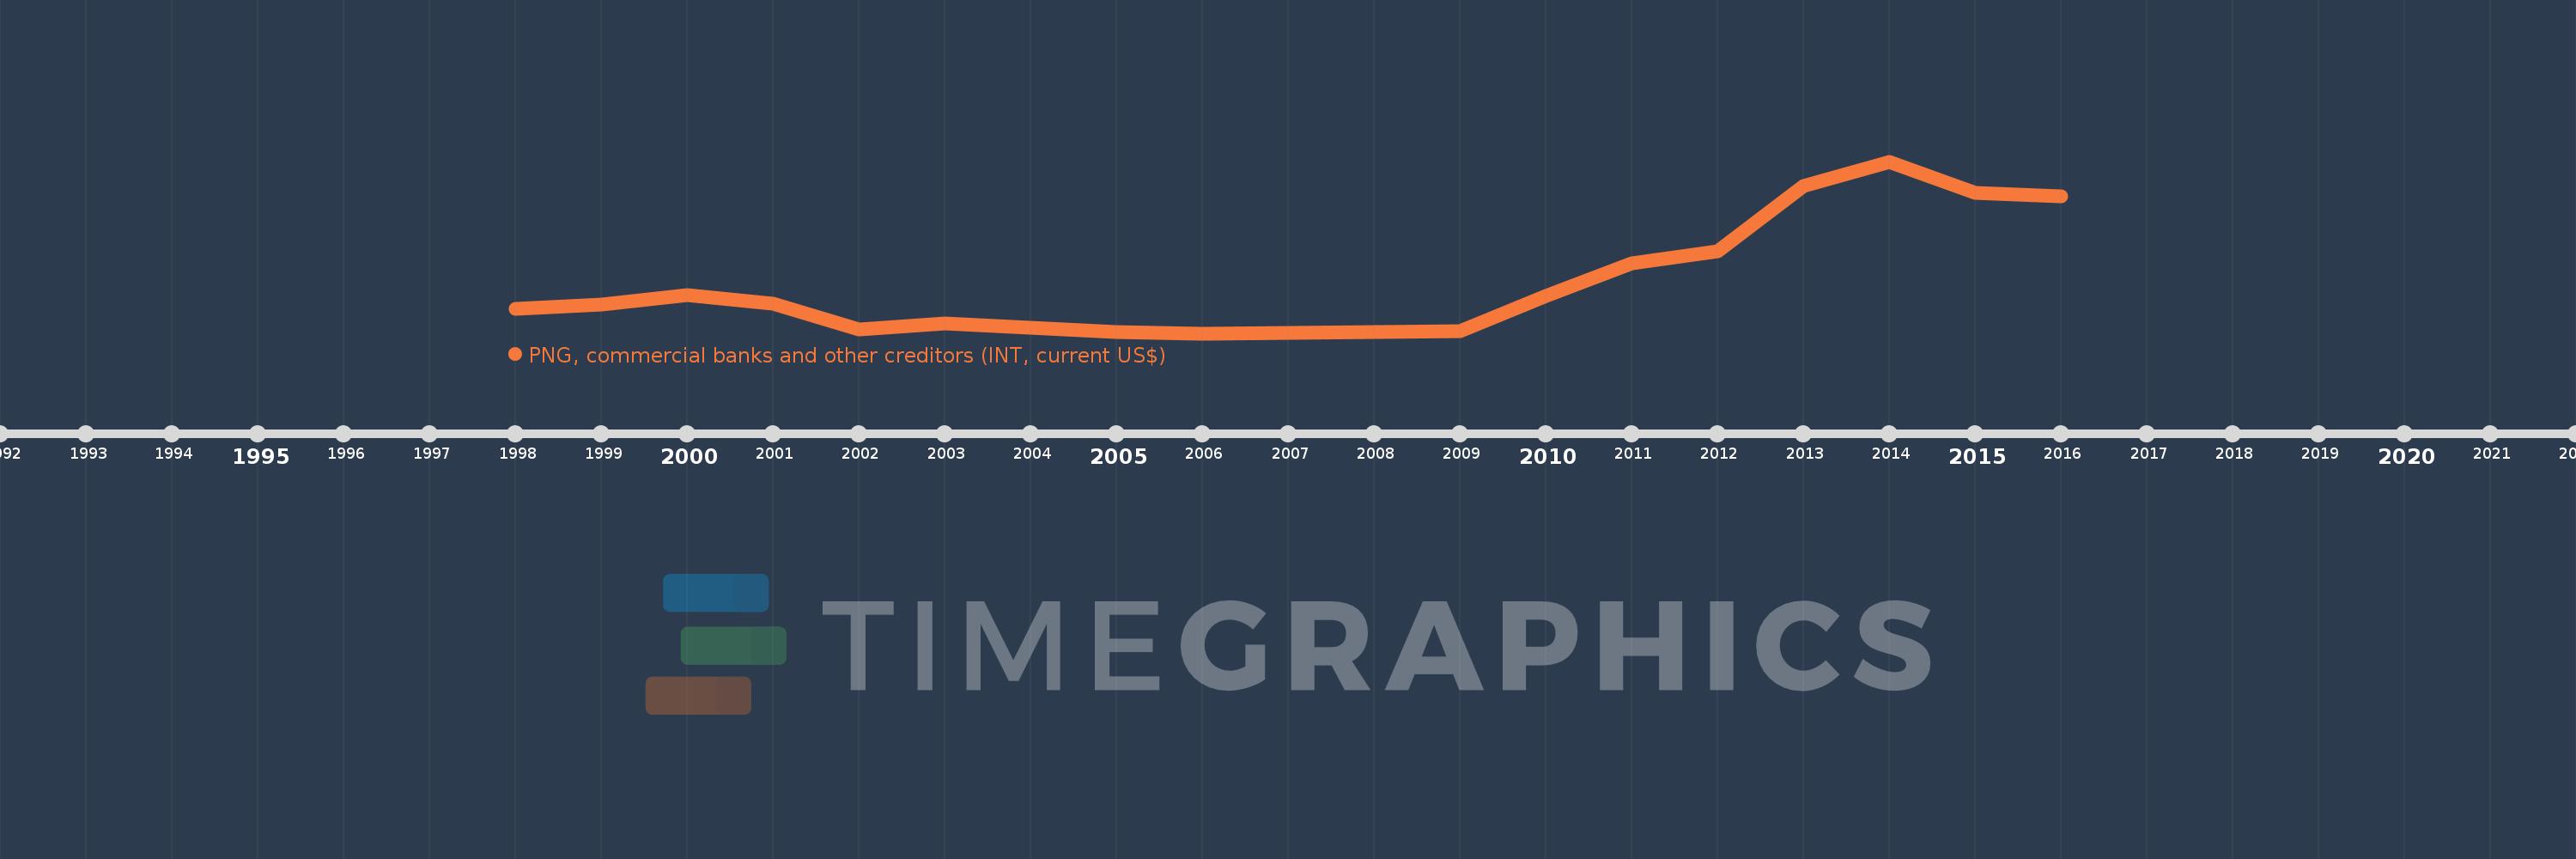
This timeline shows a graph from
1998
to
2016
of Tajikistan. No data until
1997
. Number of actual observations by date:
19
.
Source name:
World Development Indicators
Source organization:
World Bank, International Debt Statistics.
Categories, topics:
External Debt
Last updated:
apr 23, 2017
Indicators value changes by year
Meaning:
21.85 mln
Minimum:
1.201 mln
jan 1, 2006
Maximum:
73.534 mln
jan 1, 2014
At the date of observation
Value
Absolute change
Change from the previous value
jan 1, 1998
11.68 mln
+11.68 mln
0.0%
jan 1, 1999
13.24 mln
+1.56 mln
13.36%
jan 1, 2000
17.158 mln
+3.918 mln
29.59%
jan 1, 2001
13.734 mln
-3.424 mln
-19.96%
jan 1, 2002
2.819 mln
-10.915 mln
-79.47%
jan 1, 2003
5.315 mln
+2.496 mln
88.54%
jan 1, 2004
3.688 mln
-1.627 mln
-30.61%
jan 1, 2005
1.792 mln
-1.896 mln
-51.41%
jan 1, 2006
1.201 mln
-591.0K
-32.98%
jan 1, 2007
1.435 mln
+234.0K
19.48%
jan 1, 2008
1.856 mln
+421.0K
29.34%
jan 1, 2009
2.075 mln
+219.0K
11.8%
jan 1, 2010
16.798 mln
+14.723 mln
709.54%
jan 1, 2011
30.772 mln
+13.974 mln
83.19%
jan 1, 2012
35.756 mln
+4.984 mln
16.2%
jan 1, 2013
63.232 mln
+27.476 mln
76.84%
jan 1, 2014
73.534 mln
+10.302 mln
16.29%
jan 1, 2015
60.274 mln
-13.26 mln
-18.03%
jan 1, 2016
58.795 mln
-1.479 mln
-2.45%
Ranking of countries by current statistics by years
About & Feedback
Terms
Privacy
FAQ
Support 24/7
Cabinet
Get premium
Donate
The service accepts bank transfer (ACH, Wire) or cards (Visa, MasterCard, etc). Processed by Stripe.
Secured with SSL