33
/
AIzaSyB4mHJ5NPEv-XzF7P6NDYXjlkCWaeKw5bc
November 1, 2025
258782
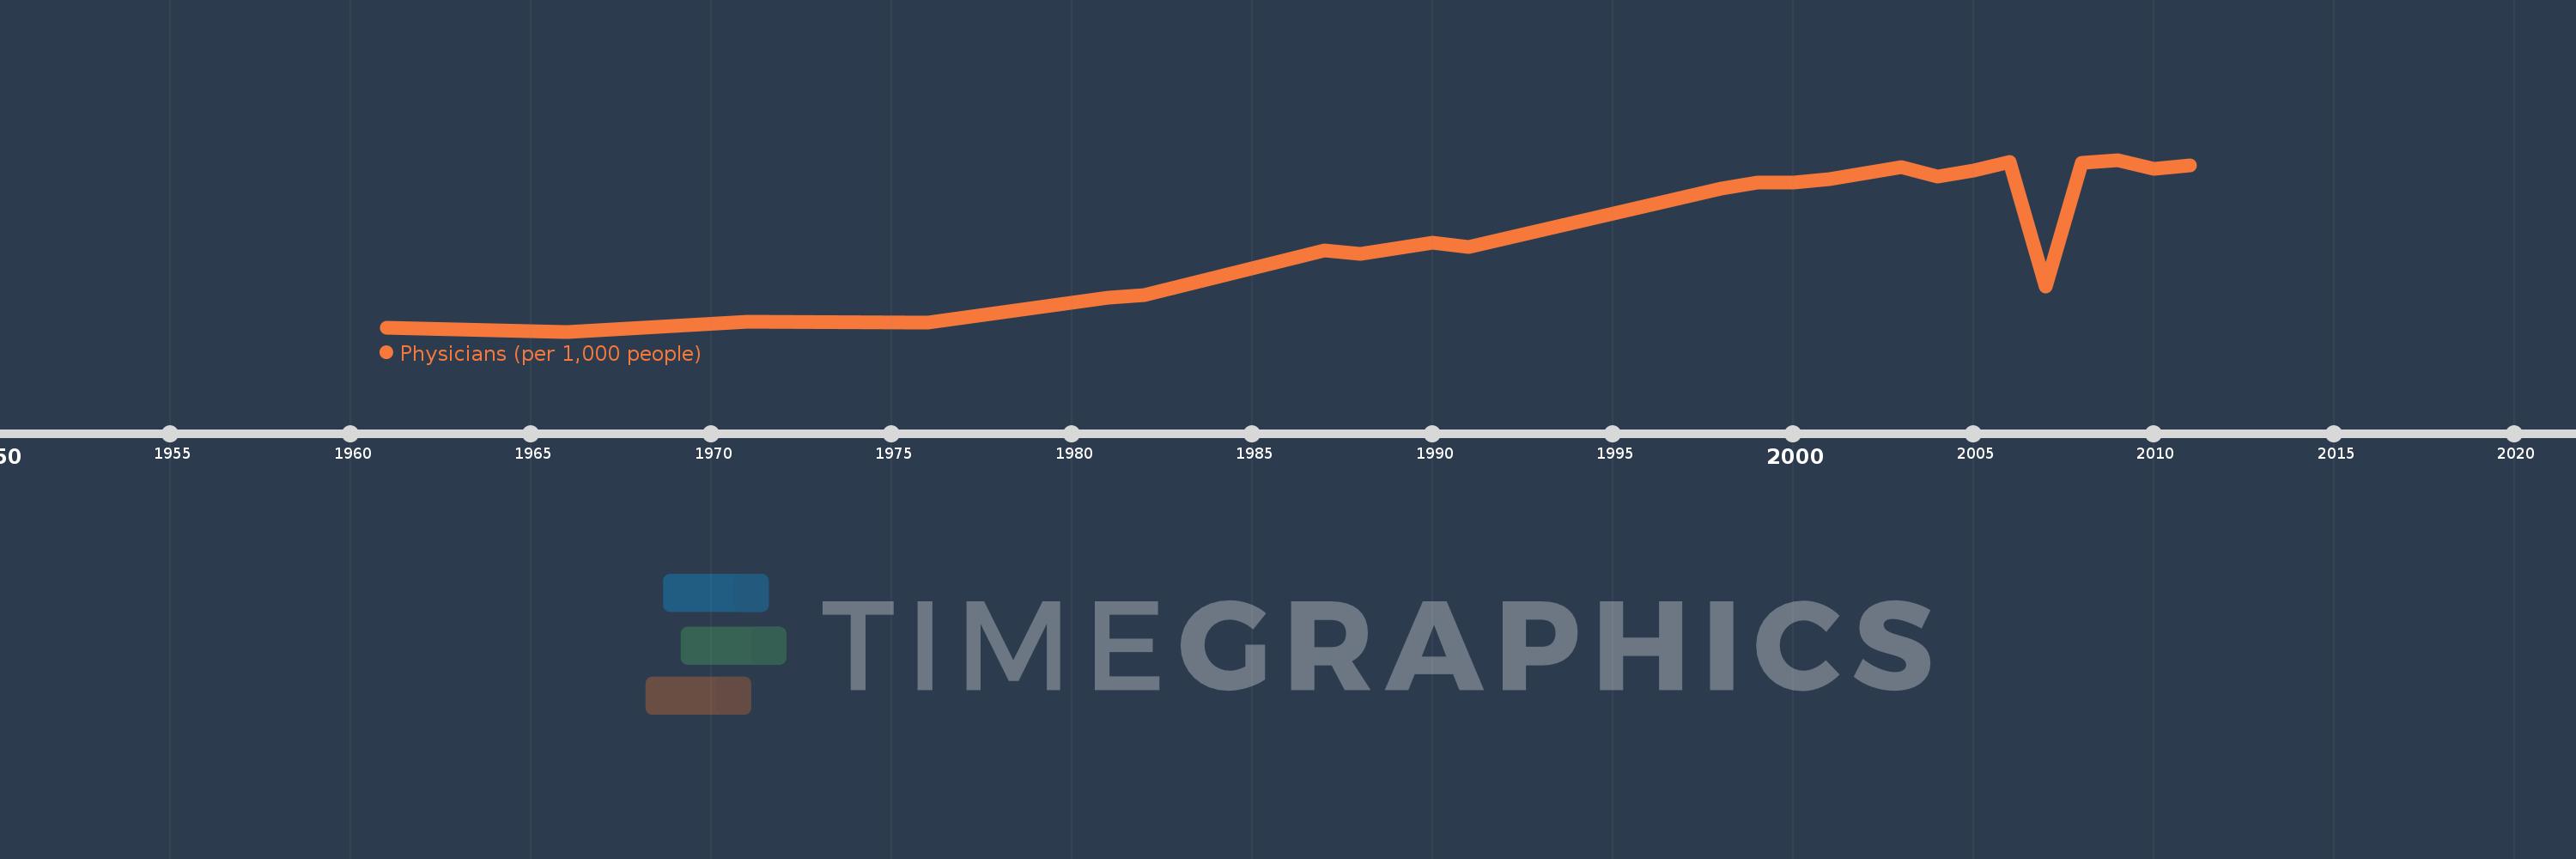
Syrian Arab Republic
SYR
true
2
1
Physicians (per 1,000 people)
2011,2010,2009,2008,2007,2006,2005,2004,2003,2002,2001,2000,1999,1998,1991,1990,1988,1987,1982,1981,1976,1971,1966,1961