33
/
AIzaSyB4mHJ5NPEv-XzF7P6NDYXjlkCWaeKw5bc
November 30, 2025
258286
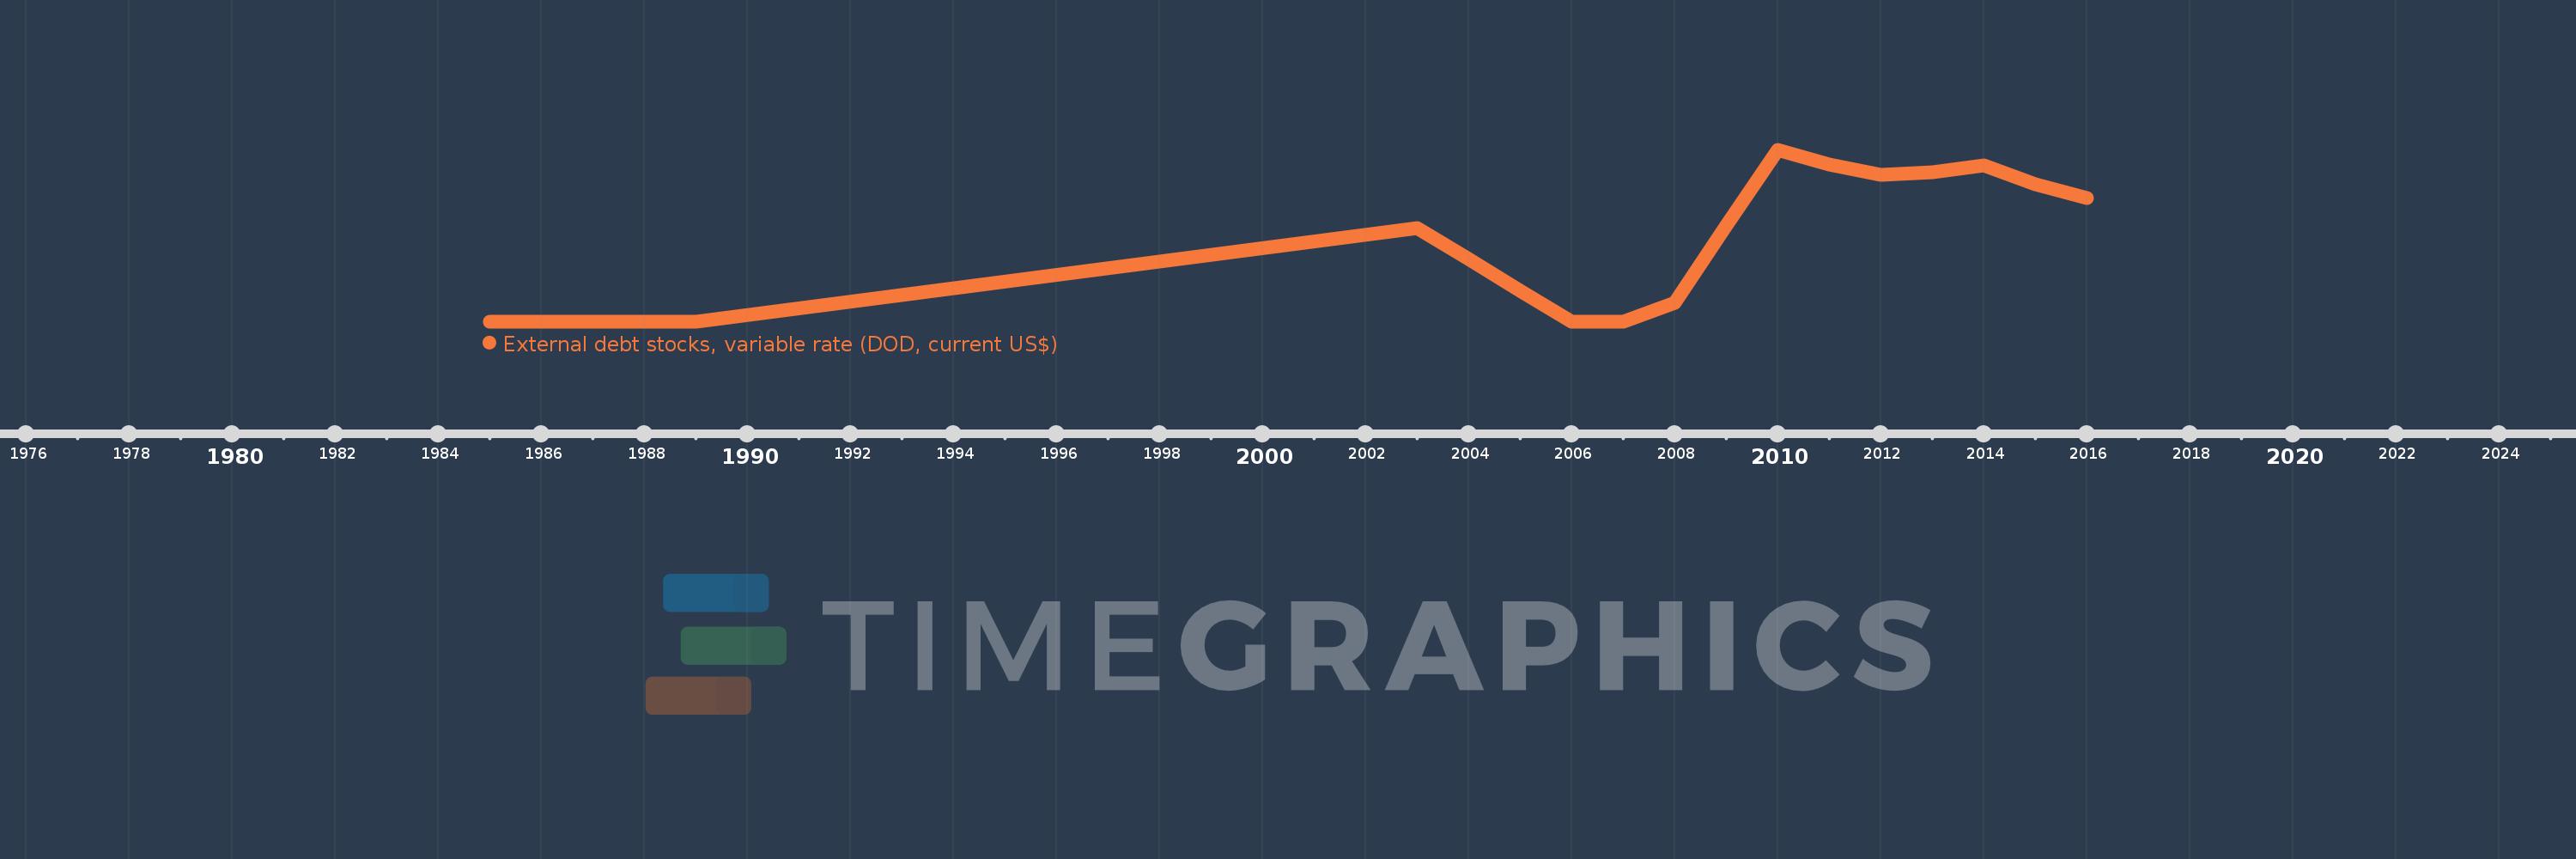
Syrian Arab Republic
SYR
true
2
1
External debt stocks, variable rate (DOD, current US$)
2016,2015,2014,2013,2012,2011,2010,2009,2008,2007,2006,2005,2004,2003,1989,1988,1987,1986,1985