33
/
AIzaSyB4mHJ5NPEv-XzF7P6NDYXjlkCWaeKw5bc
November 30, 2025
258229
Syrian Arab Republic
SYR
true
2
1
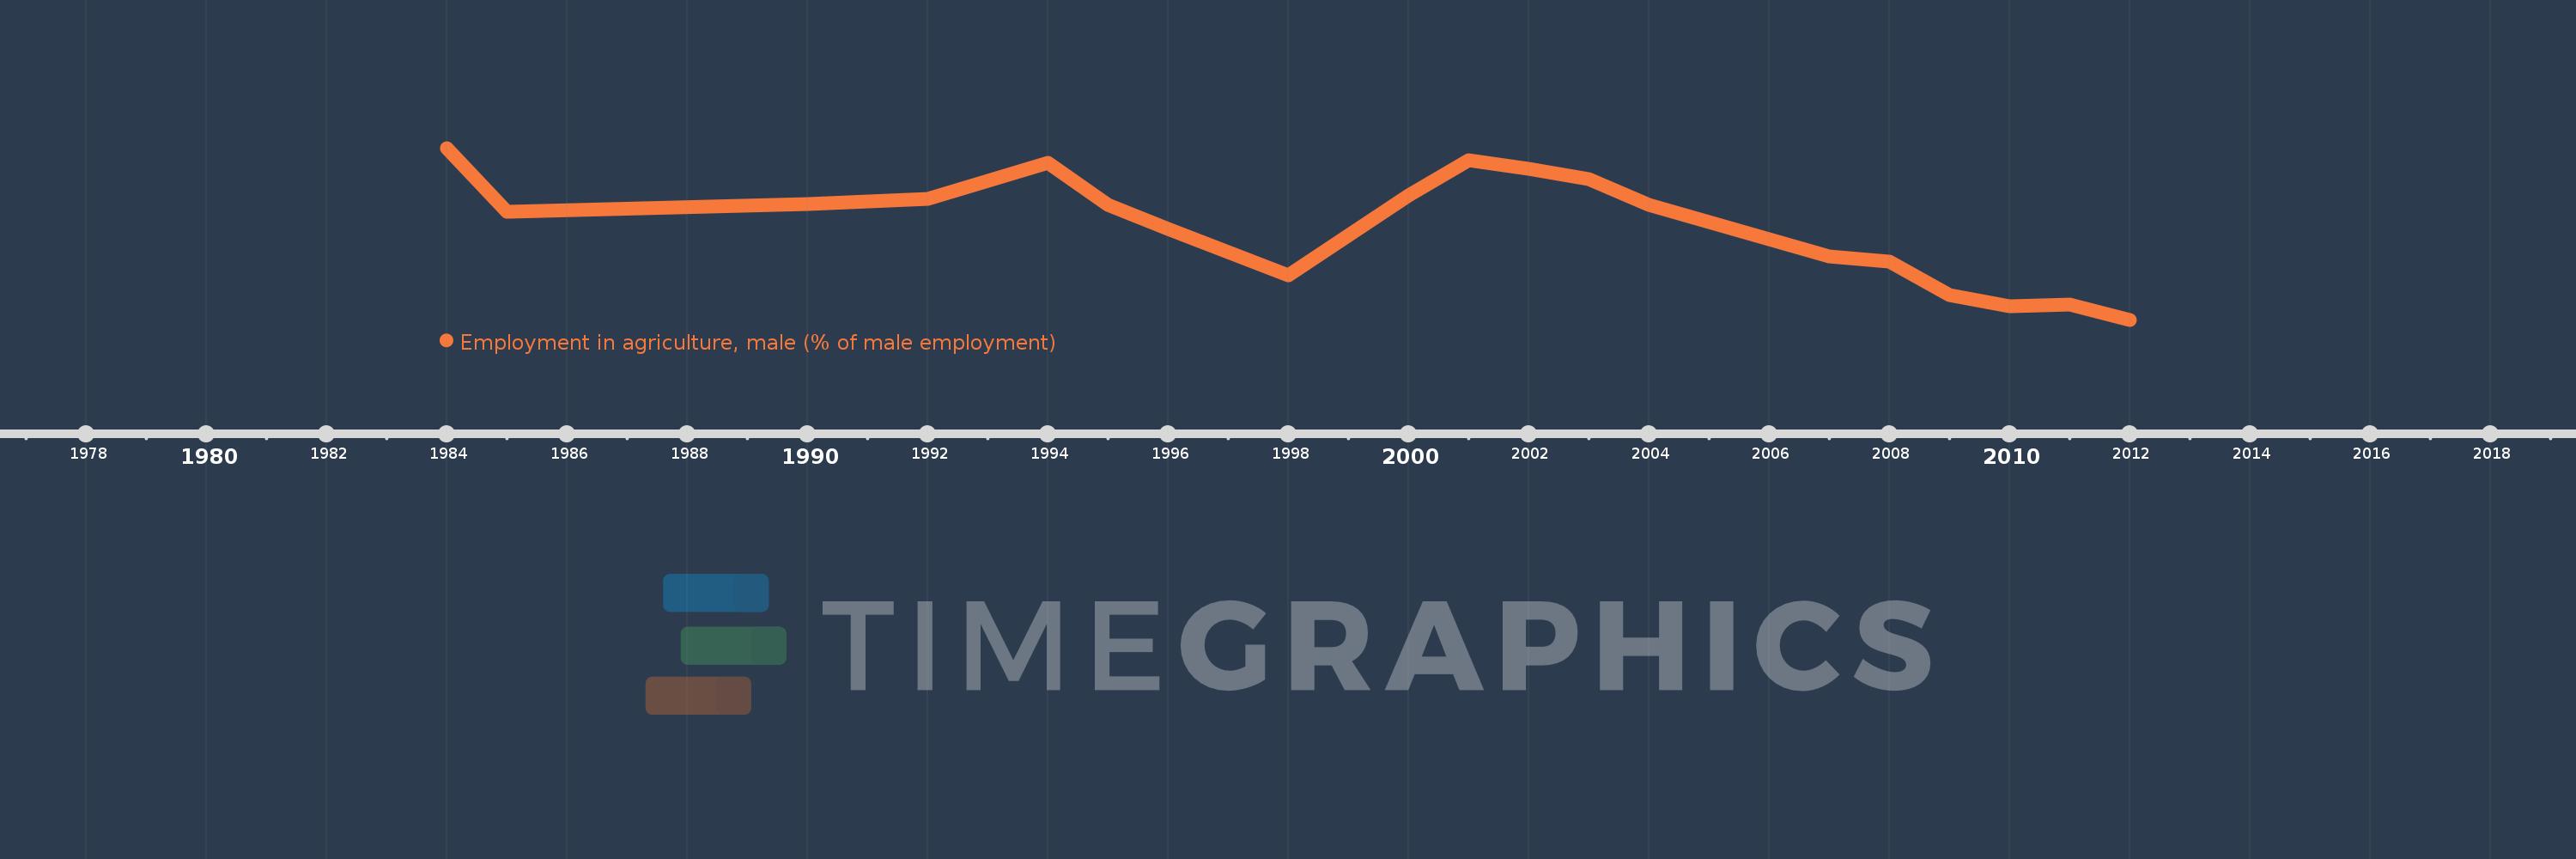
Employment in agriculture, male (% of male employment)
2012,2011,2010,2009,2008,2007,2004,2003,2002,2001,2000,1998,1996,1995,1994,1992,1990,1985,1984