33
/
AIzaSyB4mHJ5NPEv-XzF7P6NDYXjlkCWaeKw5bc
November 30, 2025
253560
Sudan
SDN
true
2
1
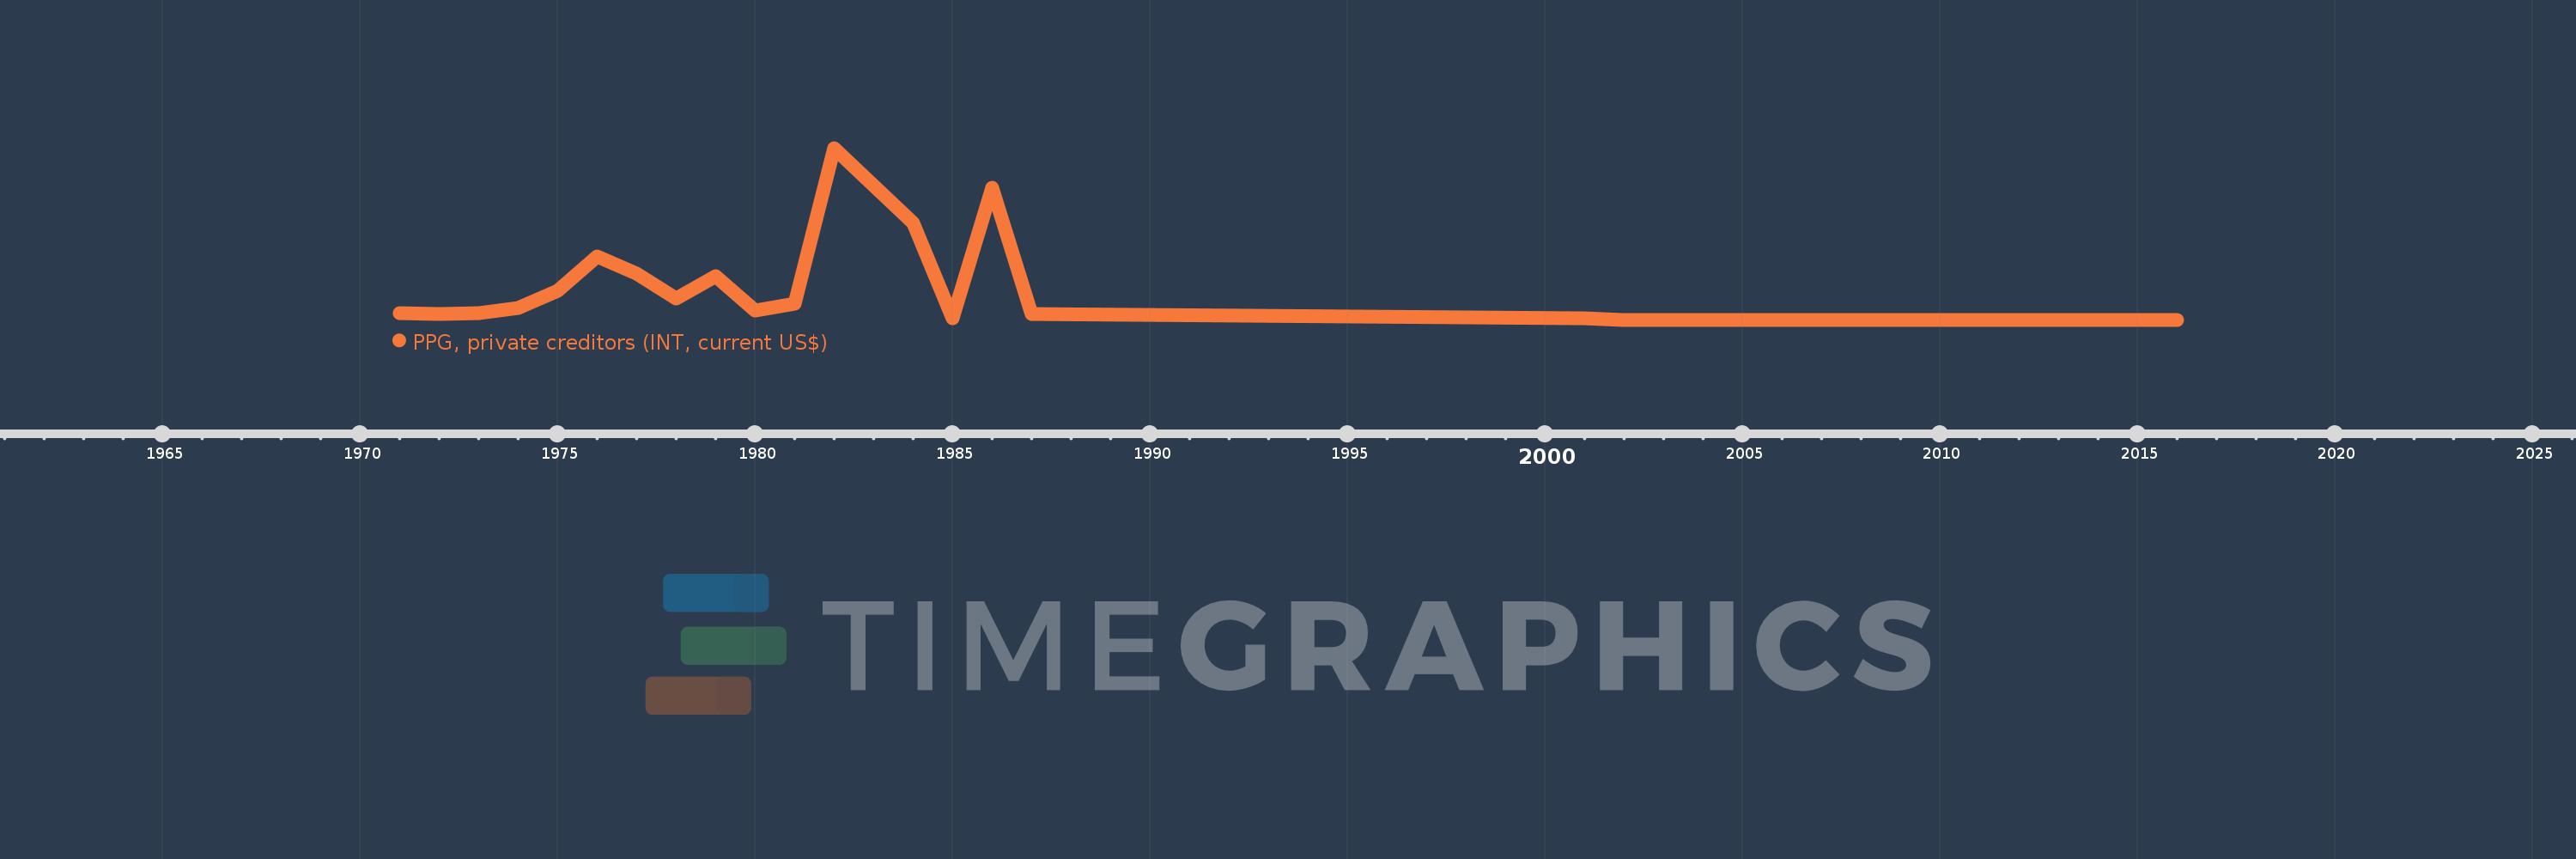
PPG, private creditors (INT, current US$)
2016,2015,2014,2013,2012,2011,2002,2001,1987,1986,1985,1984,1982,1981,1980,1979,1978,1977,1976,1975,1974,1973,1972,1971