33
/
AIzaSyB4mHJ5NPEv-XzF7P6NDYXjlkCWaeKw5bc
November 30, 2025
252888
Sudan
SDN
true
2
1
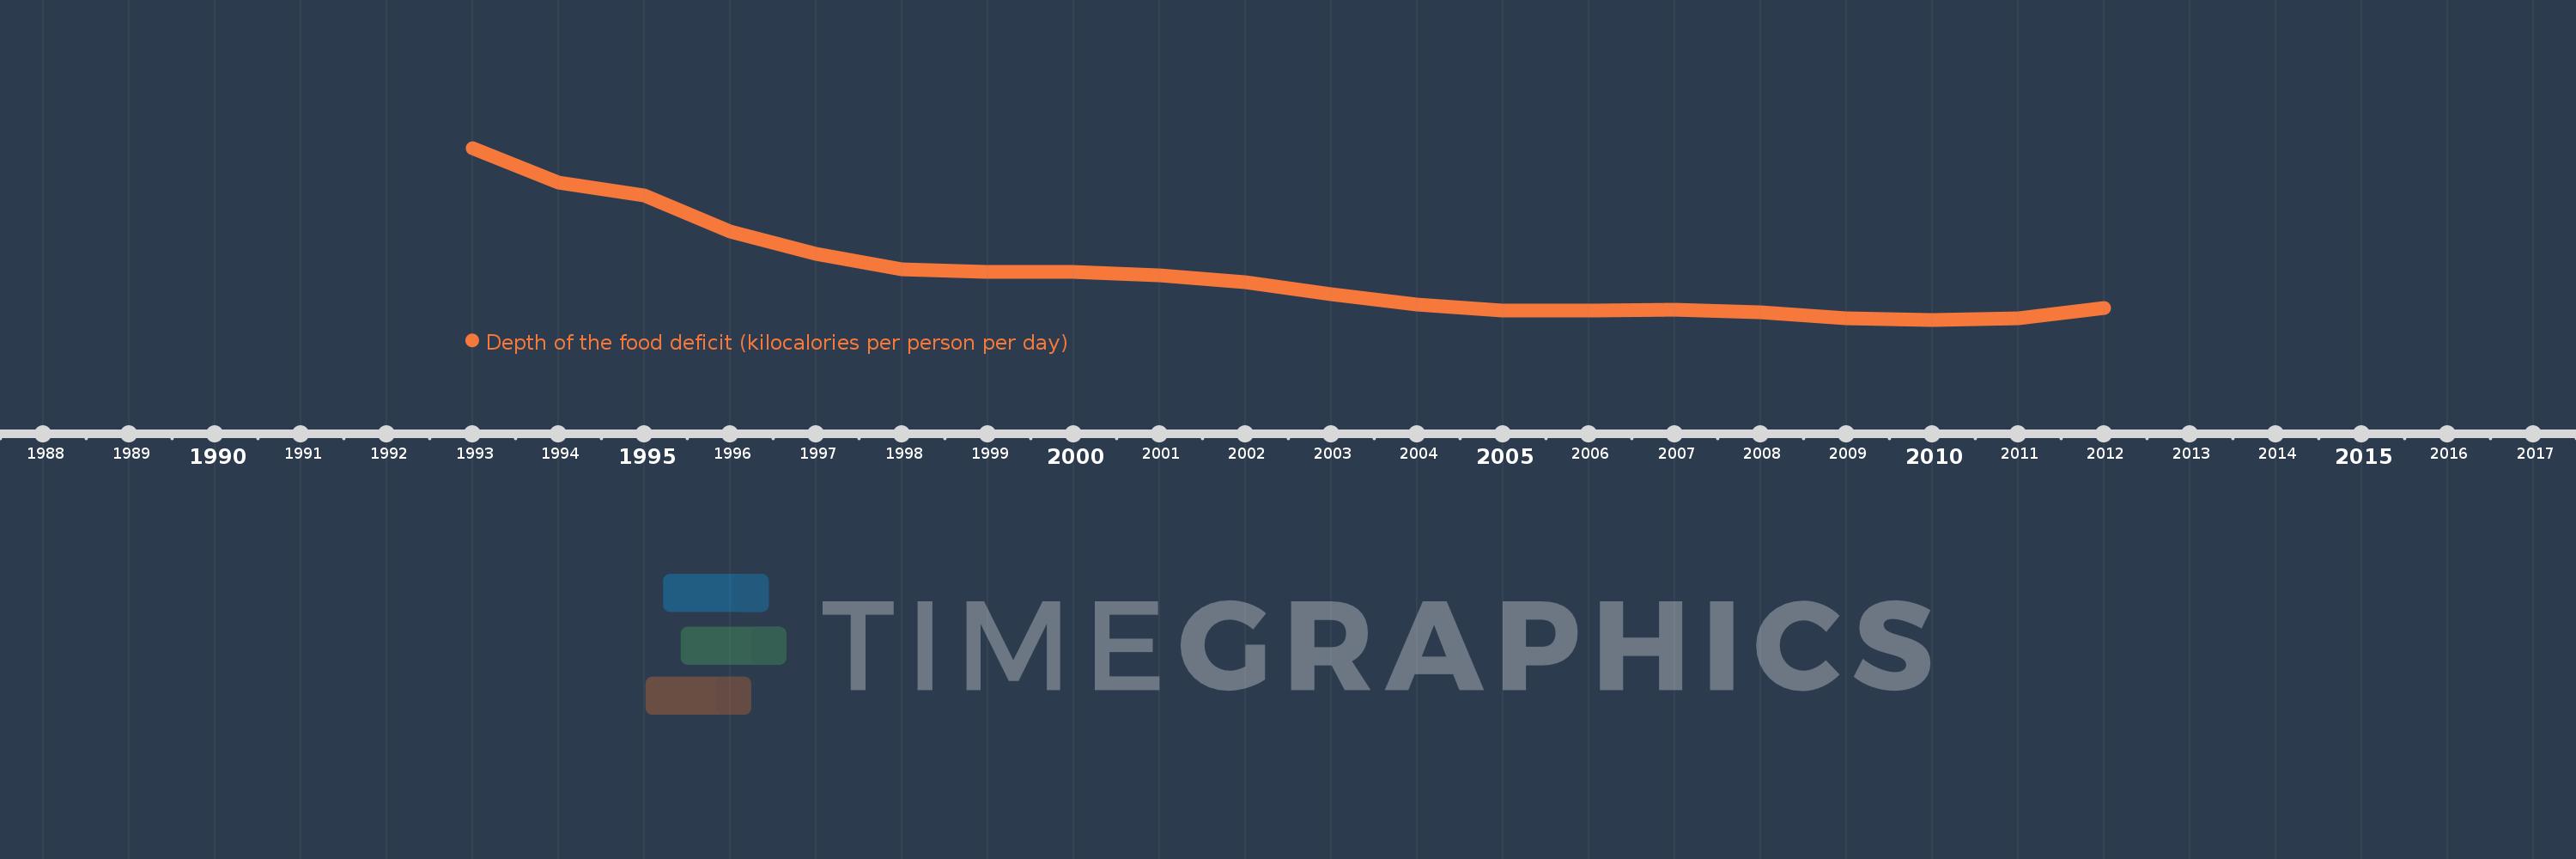
Depth of the food deficit (kilocalories per person per day)
2012,2011,2010,2009,2008,2007,2006,2005,2004,2003,2002,2001,2000,1999,1998,1997,1996,1995,1994,1993
Create a timeline
Public Timelines
For education
For educational institutions
For teachers
For students
Cabinet
For educational institutions
For teachers
For students
Open cabinet
FAQ
Close
Create a timeline
Public timelines
FAQ
About & Feedback
Terms
Privacy
FAQ
Support 24/7
Cabinet
Get premium
Donate
Download
Global statistics library
→
Sudan
→
Depth of the food deficit (kilocalories per person per day)
This statistics in other country:
Afghanistan
Algeria
Angola
Arab World
Argentina
Armenia
Azerbaijan
Bangladesh
Barbados
Belize
Benin
Bolivia
Botswana
Brazil
Brunei Darussalam
Burkina Faso
Cabo Verde
Cambodia
Cameroon
Caribbean small states
Central African Republic
Chad
Chile
China
Colombia
Congo, Rep.
Costa Rica
Cote d'Ivoire
Cuba
Djibouti
Dominican Republic
Early-demographic dividend
East Asia & Pacific
East Asia & Pacific (excluding high income)
East Asia & Pacific (IDA & IBRD countries)
Ecuador
Egypt, Arab Rep.
El Salvador
Ethiopia
Fiji
Fragile and conflict affected situations
Gabon
Gambia, The
Georgia
Ghana
Guatemala
Guinea
Guinea-Bissau
Guyana
Haiti
Heavily indebted poor countries (HIPC)
Honduras
IBRD only
IDA & IBRD total
IDA blend
IDA only
IDA total
India
Indonesia
Iran, Islamic Rep.
Iraq
Jamaica
Jordan
Kazakhstan
Kenya
Kiribati
Korea, Dem. People’s Rep.
Korea, Rep.
Kuwait
Kyrgyz Republic
Lao PDR
Late-demographic dividend
Latin America & Caribbean
Latin America & Caribbean (excluding high income)
Latin America & the Caribbean (IDA & IBRD countries)
Least developed countries: UN classification
Lebanon
Lesotho
Liberia
Low & middle income
Low income
Lower middle income
Madagascar
Malawi
Malaysia
Maldives
Mali
Mauritania
Mauritius
Mexico
Middle East & North Africa
Middle East & North Africa (excluding high income)
Middle East & North Africa (IDA & IBRD countries)
Middle income
Mongolia
Morocco
Mozambique
Myanmar
Namibia
Nepal
Nicaragua
Niger
Nigeria
Oman
Other small states
Pacific island small states
Pakistan
Panama
Paraguay
Peru
Philippines
Pre-demographic dividend
Rwanda
Samoa
Sao Tome and Principe
Saudi Arabia
Senegal
Sierra Leone
Small states
Solomon Islands
South Africa
South Asia
South Asia (IDA & IBRD)
Sri Lanka
St. Vincent and the Grenadines
Sub-Saharan Africa
Sub-Saharan Africa (excluding high income)
Sub-Saharan Africa (IDA & IBRD countries)
Sudan
Suriname
Swaziland
Tajikistan
Tanzania
Thailand
Timor-Leste
Togo
Trinidad and Tobago
Tunisia
Turkey
Turkmenistan
Uganda
United Arab Emirates
Upper middle income
Uruguay
Uzbekistan
Vanuatu
Venezuela, RB
Vietnam
World
Yemen, Rep.
Zambia
Zimbabwe
Timeline:
This timeline shows a graph from
1993
to
2012
of Sudan. No data until
1992
. Number of actual observations by date:
20
.
Source name:
World Development Indicators
Source organization:
Food and Agriculture Organization, Food Security Statistics.
Categories, topics:
Health
Last updated:
apr 23, 2017
Indicators value changes by year
Meaning:
198.35
Minimum:
168.0
jan 1, 2010
Maximum:
283.0
jan 1, 1993
At the date of observation
Value
Absolute change
Change from the previous value
jan 1, 1993
283.0
+283.0
0.0%
jan 1, 1994
260.0
-23.0
-8.13%
jan 1, 1995
251.0
-9.0
-3.46%
jan 1, 1996
227.0
-24.0
-9.56%
jan 1, 1997
212.0
-15.0
-6.61%
jan 1, 1998
202.0
-10.0
-4.72%
jan 1, 1999
200.0
-2.0
-0.99%
jan 1, 2000
200.0
0.0
0.0%
jan 1, 2001
198.0
-2.0
-1.0%
jan 1, 2002
193.0
-5.0
-2.53%
jan 1, 2003
185.0
-8.0
-4.15%
jan 1, 2004
178.0
-7.0
-3.78%
jan 1, 2005
174.0
-4.0
-2.25%
jan 1, 2006
174.0
0.0
0.0%
jan 1, 2007
175.0
+1.0
0.57%
jan 1, 2008
173.0
-2.0
-1.14%
jan 1, 2009
169.0
-4.0
-2.31%
jan 1, 2010
168.0
-1.0
-0.59%
jan 1, 2011
169.0
+1.0
0.6%
jan 1, 2012
176.0
+7.0
4.14%
Ranking of countries by current statistics by years
About & Feedback
Terms
Privacy
FAQ
Support 24/7
Cabinet
Get premium
Donate
The service accepts bank transfer (ACH, Wire) or cards (Visa, MasterCard, etc). Processed by Stripe.
Secured with SSL