33
/
AIzaSyB4mHJ5NPEv-XzF7P6NDYXjlkCWaeKw5bc
November 30, 2025
251371
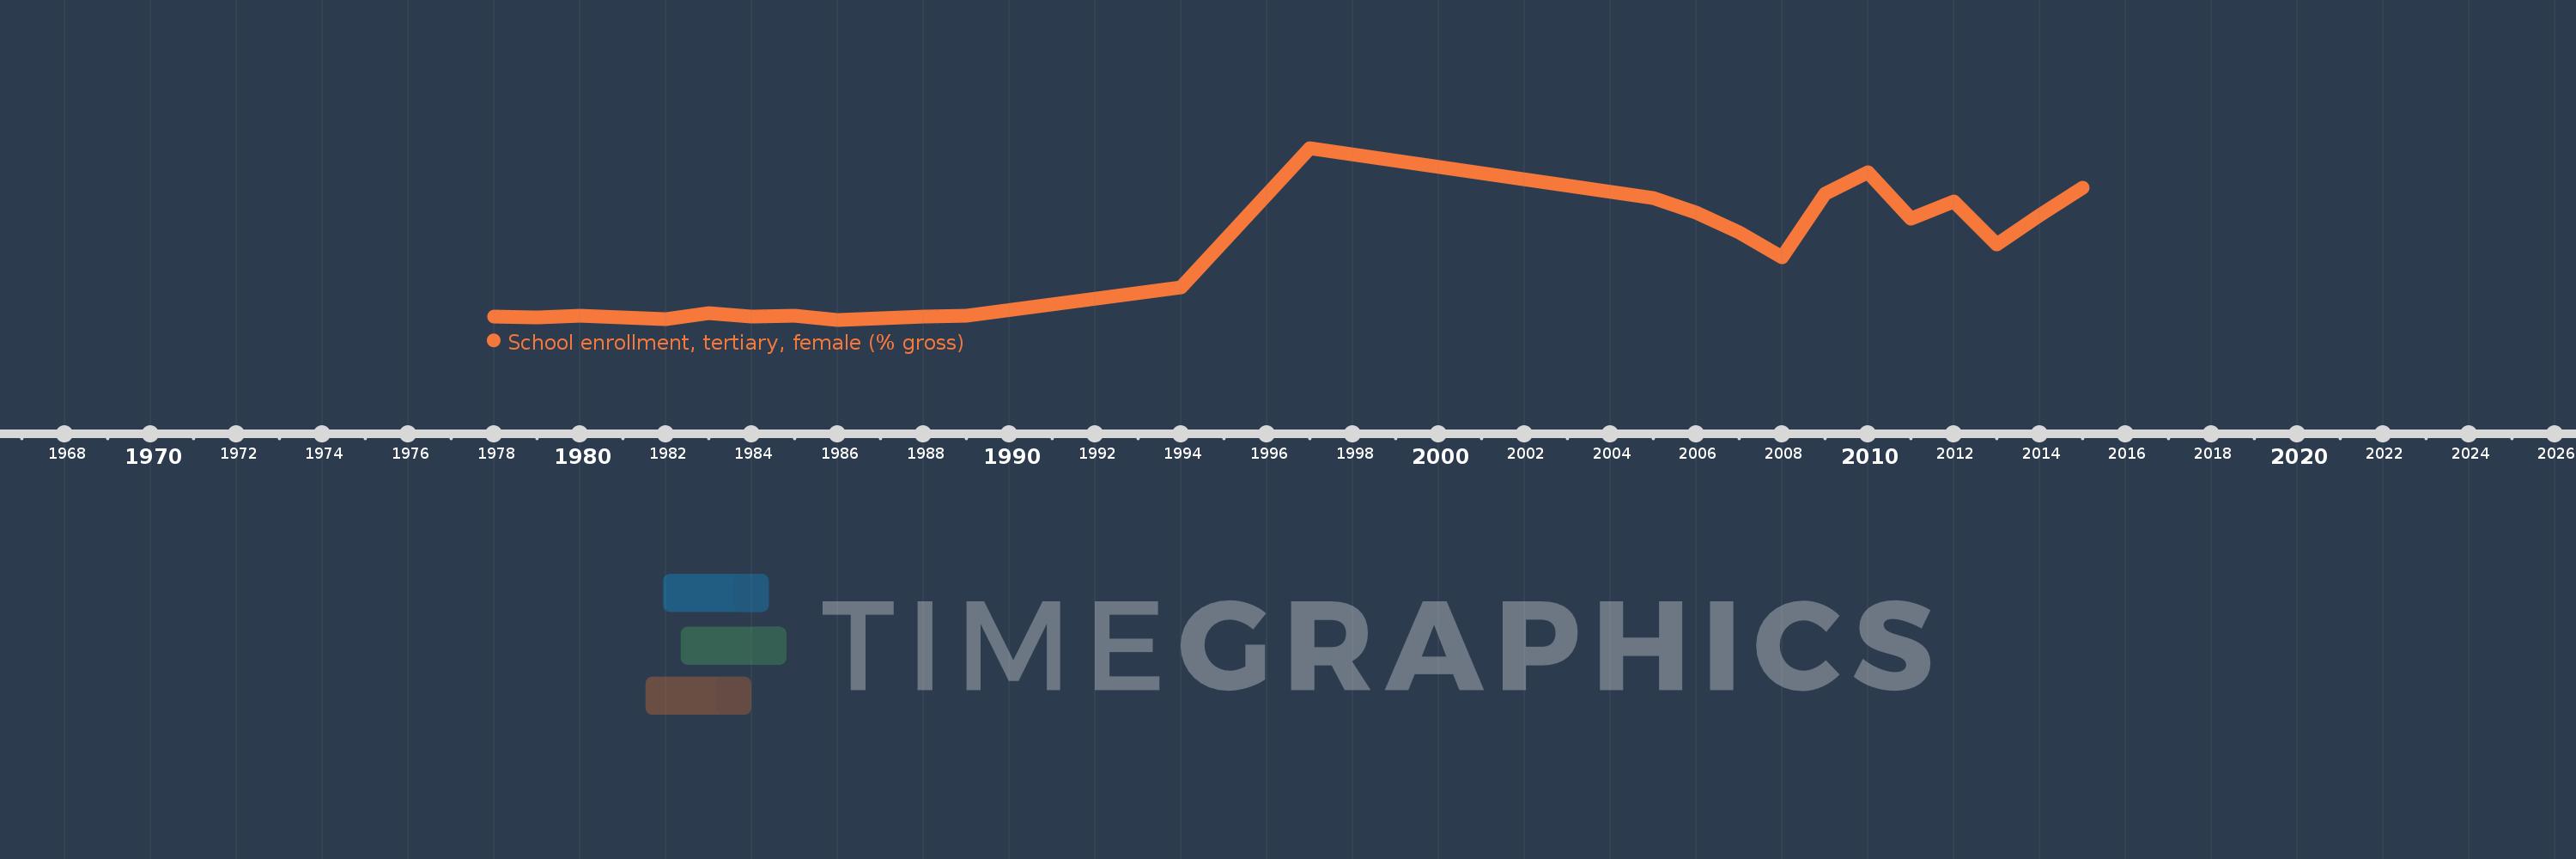
St. Lucia
LCA
true
2
1
School enrollment, tertiary, female (% gross)
2015,2014,2013,2012,2011,2010,2009,2008,2007,2006,2005,1997,1994,1989,1988,1986,1985,1984,1983,1982,1981,1980,1979,1978