33
/
AIzaSyB4mHJ5NPEv-XzF7P6NDYXjlkCWaeKw5bc
November 30, 2025
248908
Sri Lanka
LKA
true
2
1
International tourism, number of departures
2015,2014,2013,2012,2011,2010,2009,2008,2007,2006,2005,2004,2003,2002,2001,2000,1999,1998,1997,1996
Create a timeline
Public Timelines
For education
For educational institutions
For teachers
For students
Cabinet
For educational institutions
For teachers
For students
Open cabinet
FAQ
Close
Create a timeline
Public timelines
FAQ
About & Feedback
Terms
Privacy
FAQ
Support 24/7
Cabinet
Get premium
Donate
Download
Global statistics library
→
Sri Lanka
→
International tourism, number of departures
This statistics in other country:
Albania
Algeria
Angola
Antigua and Barbuda
Argentina
Armenia
Australia
Austria
Azerbaijan
Bangladesh
Belarus
Belgium
Bermuda
Bolivia
Brazil
British Virgin Islands
Bulgaria
Burundi
Cambodia
Canada
Central African Republic
Central Europe and the Baltics
Chad
Chile
China
Colombia
Congo, Dem. Rep.
Congo, Rep.
Costa Rica
Croatia
Cuba
Cyprus
Czech Republic
Denmark
Dominican Republic
Early-demographic dividend
East Asia & Pacific
East Asia & Pacific (excluding high income)
East Asia & Pacific (IDA & IBRD countries)
Ecuador
Egypt, Arab Rep.
El Salvador
Estonia
Ethiopia
Euro area
Europe & Central Asia
Europe & Central Asia (excluding high income)
Europe & Central Asia (IDA & IBRD countries)
European Union
Fiji
Finland
France
French Polynesia
Gabon
Gambia, The
Georgia
Germany
Greece
Guatemala
High income
Honduras
Hong Kong SAR, China
Hungary
IBRD only
Iceland
IDA & IBRD total
India
Indonesia
Iran, Islamic Rep.
Ireland
Israel
Italy
Japan
Jordan
Kazakhstan
Korea, Rep.
Kuwait
Kyrgyz Republic
Lao PDR
Late-demographic dividend
Latin America & Caribbean
Latin America & Caribbean (excluding high income)
Latin America & the Caribbean (IDA & IBRD countries)
Latvia
Libya
Lithuania
Low & middle income
Lower middle income
Luxembourg
Macao SAR, China
Madagascar
Malaysia
Maldives
Malta
Mauritius
Mexico
Middle income
Moldova
Morocco
Nepal
Netherlands
New Caledonia
New Zealand
Nicaragua
Niger
North America
Norway
OECD members
Oman
Palau
Panama
Papua New Guinea
Paraguay
Peru
Philippines
Poland
Portugal
Post-demographic dividend
Puerto Rico
Romania
Russian Federation
Samoa
Saudi Arabia
Seychelles
Sierra Leone
Singapore
Slovak Republic
Slovenia
South Africa
South Asia
South Asia (IDA & IBRD)
Spain
Sri Lanka
Sudan
Swaziland
Sweden
Switzerland
Syrian Arab Republic
Tajikistan
Tanzania
Thailand
Trinidad and Tobago
Tunisia
Turkey
Turkmenistan
Tuvalu
Uganda
Ukraine
United Kingdom
United States
Upper middle income
Uruguay
Uzbekistan
Vanuatu
Venezuela, RB
World
Zimbabwe
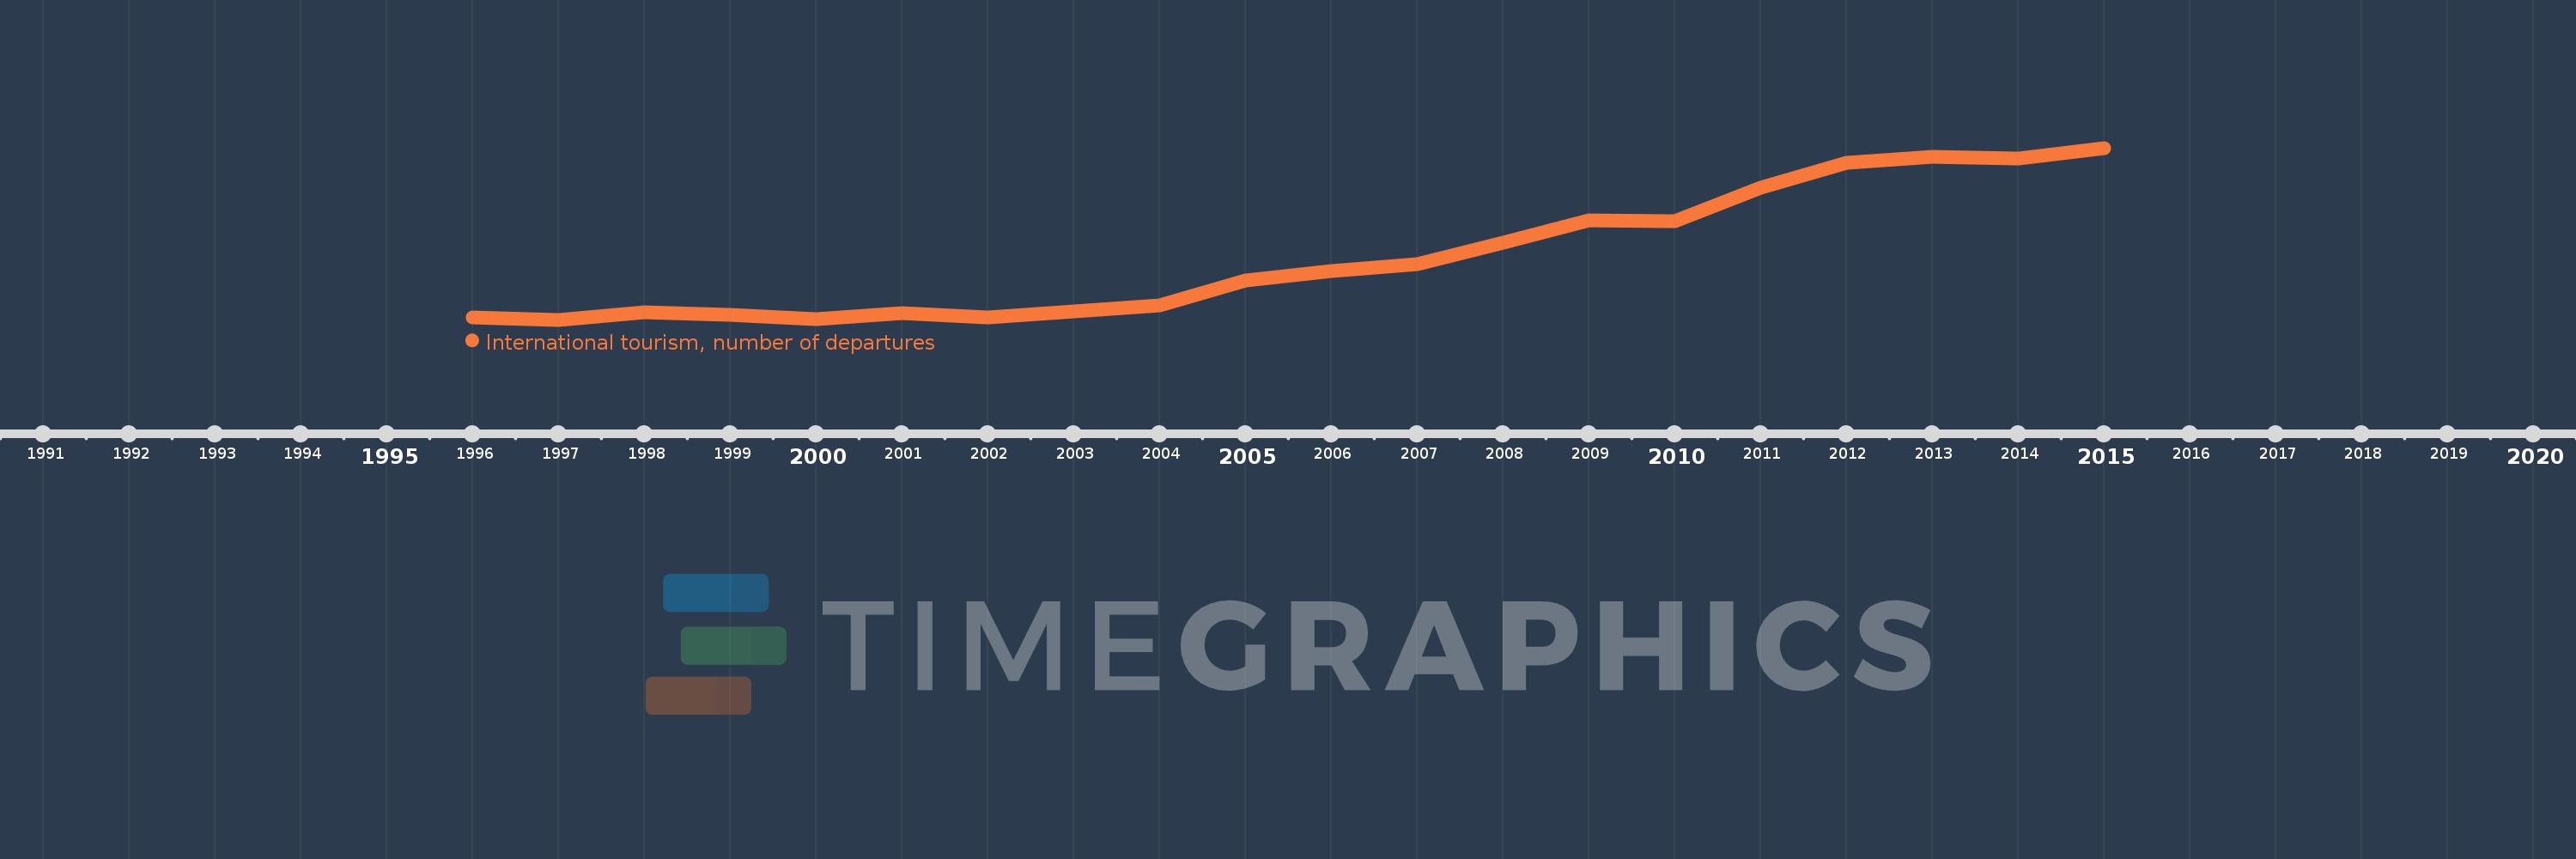
Timeline:
This timeline shows a graph from
1996
to
2015
of Sri Lanka. No data until
1995
. Number of actual observations by date:
20
.
Source name:
World Development Indicators
Source organization:
World Tourism Organization, Yearbook of Tourism Statistics, Compendium of Tourism Statistics and data files.
Categories, topics:
Private Sector, Trade
Last updated:
apr 23, 2017
Indicators value changes by year
Meaning:
791.25K
Minimum:
494.0K
jan 1, 1997
Maximum:
1.311 mln
jan 1, 2015
At the date of observation
Value
Absolute change
Change from the previous value
jan 1, 1996
504.0K
+504.0K
0.0%
jan 1, 1997
494.0K
-10.0K
-1.98%
jan 1, 1998
531.0K
+37.0K
7.49%
jan 1, 1999
518.0K
-13.0K
-2.45%
jan 1, 2000
497.0K
-21.0K
-4.05%
jan 1, 2001
524.0K
+27.0K
5.43%
jan 1, 2002
505.0K
-19.0K
-3.63%
jan 1, 2003
533.0K
+28.0K
5.54%
jan 1, 2004
561.0K
+28.0K
5.25%
jan 1, 2005
680.0K
+119.0K
21.21%
jan 1, 2006
727.0K
+47.0K
6.91%
jan 1, 2007
757.0K
+30.0K
4.13%
jan 1, 2008
862.0K
+105.0K
13.87%
jan 1, 2009
966.0K
+104.0K
12.06%
jan 1, 2010
963.0K
-3.0K
-0.31%
jan 1, 2011
1.122 mln
+159.0K
16.51%
jan 1, 2012
1.239 mln
+117.0K
10.43%
jan 1, 2013
1.269 mln
+30.0K
2.42%
jan 1, 2014
1.262 mln
-7.0K
-0.55%
jan 1, 2015
1.311 mln
+49.0K
3.88%
Ranking of countries by current statistics by years
About & Feedback
Terms
Privacy
FAQ
Support 24/7
Cabinet
Get premium
Donate
The service accepts bank transfer (ACH, Wire) or cards (Visa, MasterCard, etc). Processed by Stripe.
Secured with SSL