Download This statistics in other country:
Timeline:
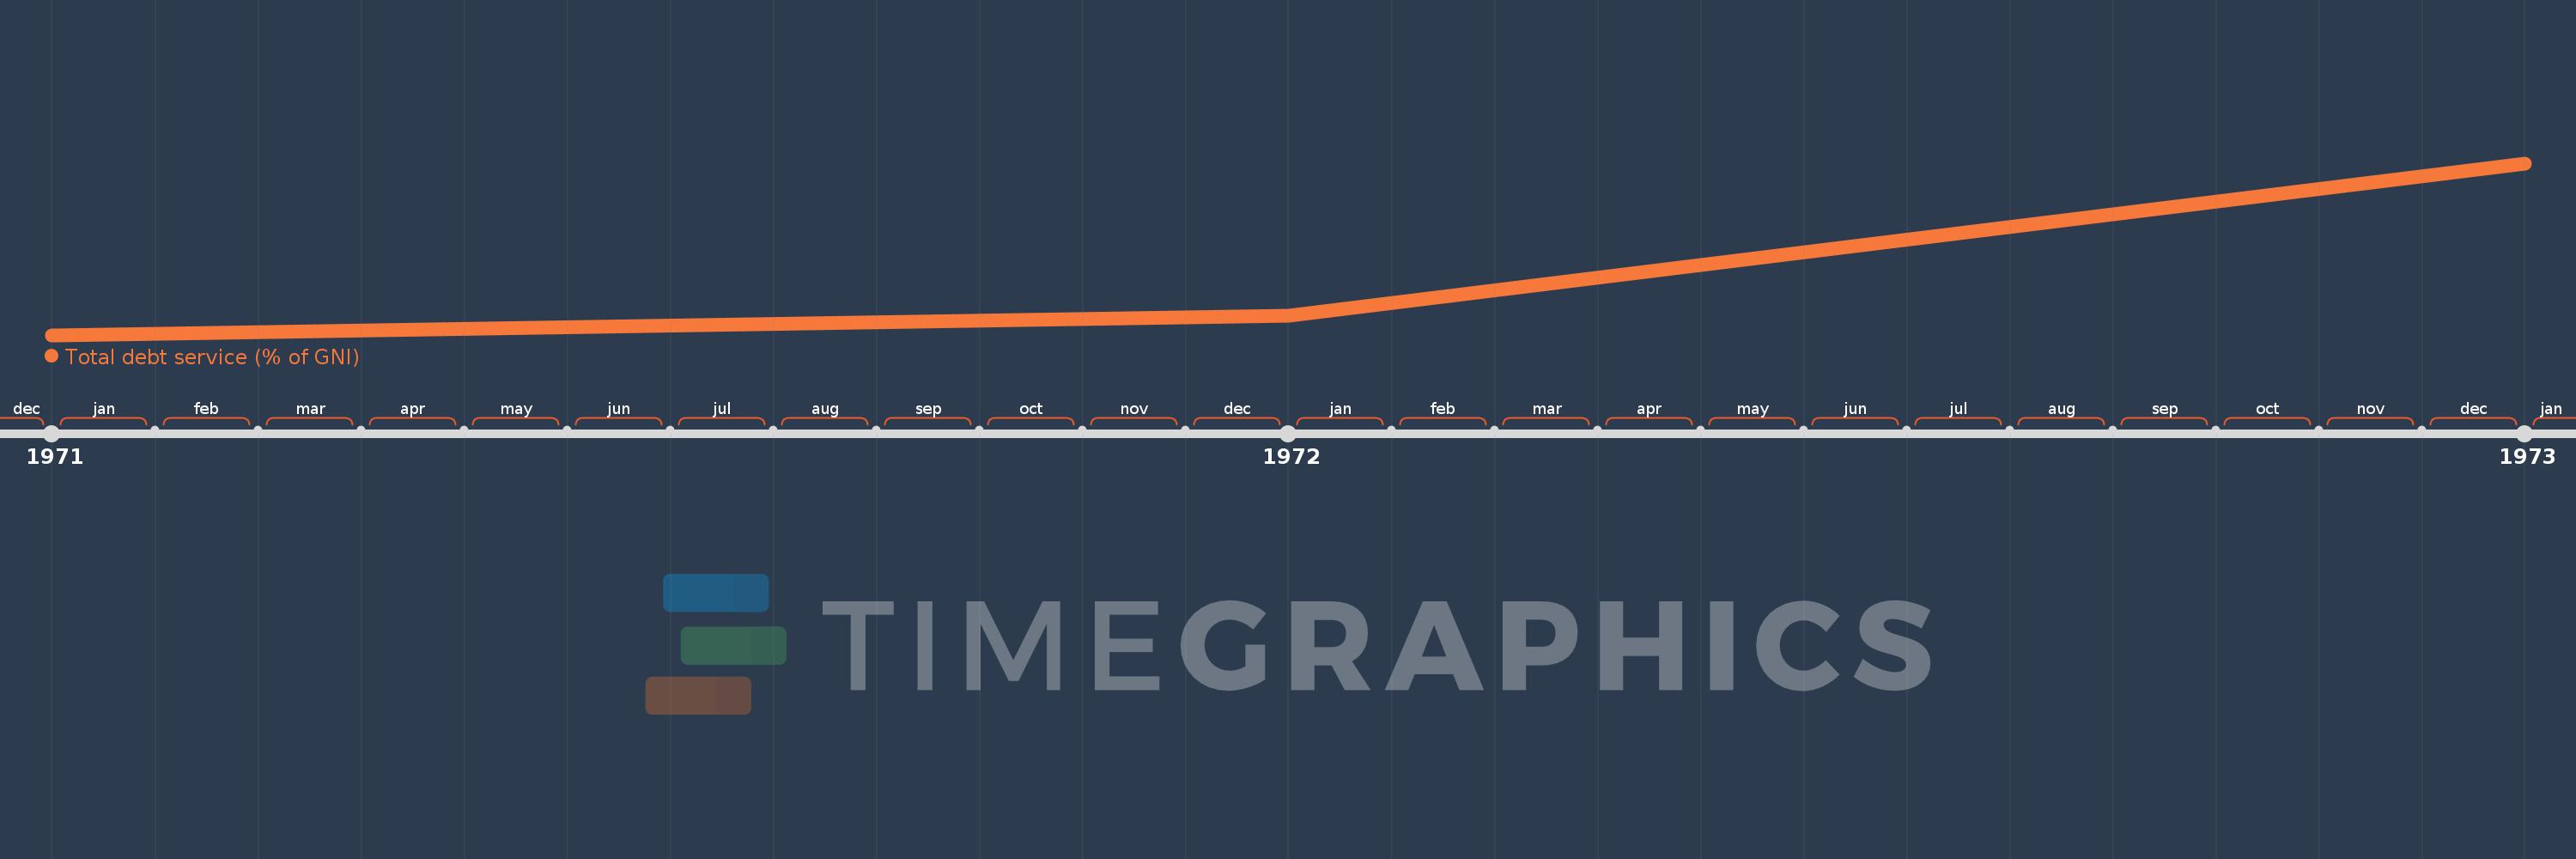
This timeline shows a graph from 1971 to 1973 of Arab World. No data until 1970. Number of actual observations by date: 3.
Source name:
World Development Indicators
Source organization:
World Bank, International Debt Statistics.
Categories, topics:
Economy & Growth, External Debt
Last updated:
apr 23, 2017
Indicators value changes by year
At the date of observation
Value
Absolute change
Change from the previous value
jan 1, 1971
2.377
+2.377
0.0%
jan 1, 1972
2.467
+0.09
3.78%
jan 1, 1973
3.181
+0.715
28.97%
Ranking of countries by current statistics by years