Download This statistics in other country:
Timeline:
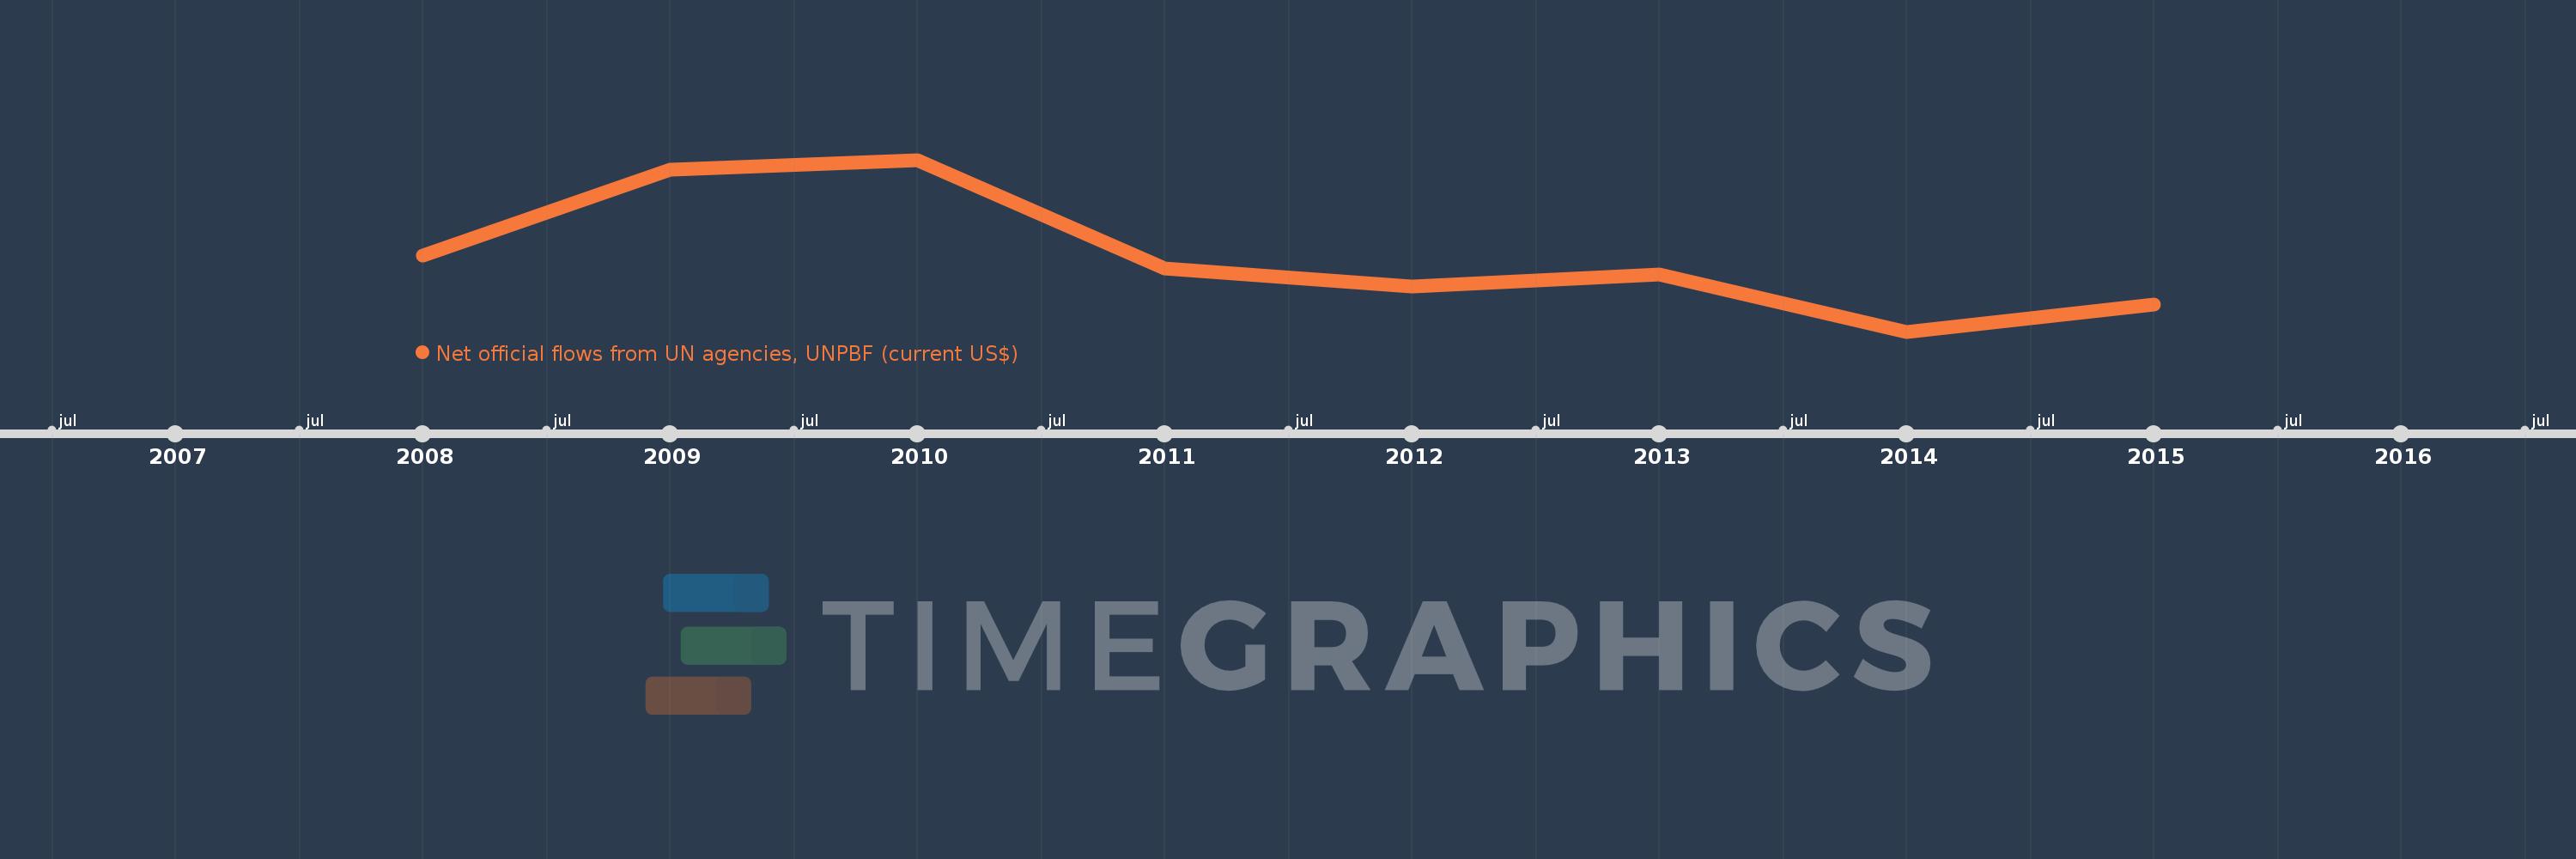
This timeline shows a graph from 2008 to 2015 of Sierra Leone. No data until 2007. Number of actual observations by date: 8.
Source name:
World Development Indicators
Source organization:
Development Assistance Committee of the Organisation for Economic Co-operation and Development, Geographical Distribution of Financial Flows to Developing Countries, Development Co-operation Report, and International Development Statistics database. Data are available online at: www.oecd.org/dac/stats/idsonline.
Categories, topics:
Aid Effectiveness
Last updated:
apr 23, 2017
Indicators value changes by year
Minimum:
720.0K
jan 1, 2014
Maximum:
12.07 mln
jan 1, 2010
At the date of observation
Value
Absolute change
Change from the previous value
jan 1, 2008
5.73 mln
+5.73 mln
0.0%
jan 1, 2009
11.4 mln
+5.67 mln
98.95%
jan 1, 2010
12.07 mln
+670.0K
5.88%
jan 1, 2011
4.88 mln
-7.19 mln
-59.57%
jan 1, 2012
3.71 mln
-1.17 mln
-23.98%
jan 1, 2013
4.49 mln
+780.0K
21.02%
jan 1, 2014
720.0K
-3.77 mln
-83.96%
jan 1, 2015
2.48 mln
+1.76 mln
244.44%
Ranking of countries by current statistics by years