33
/
AIzaSyB4mHJ5NPEv-XzF7P6NDYXjlkCWaeKw5bc
November 30, 2025
239073
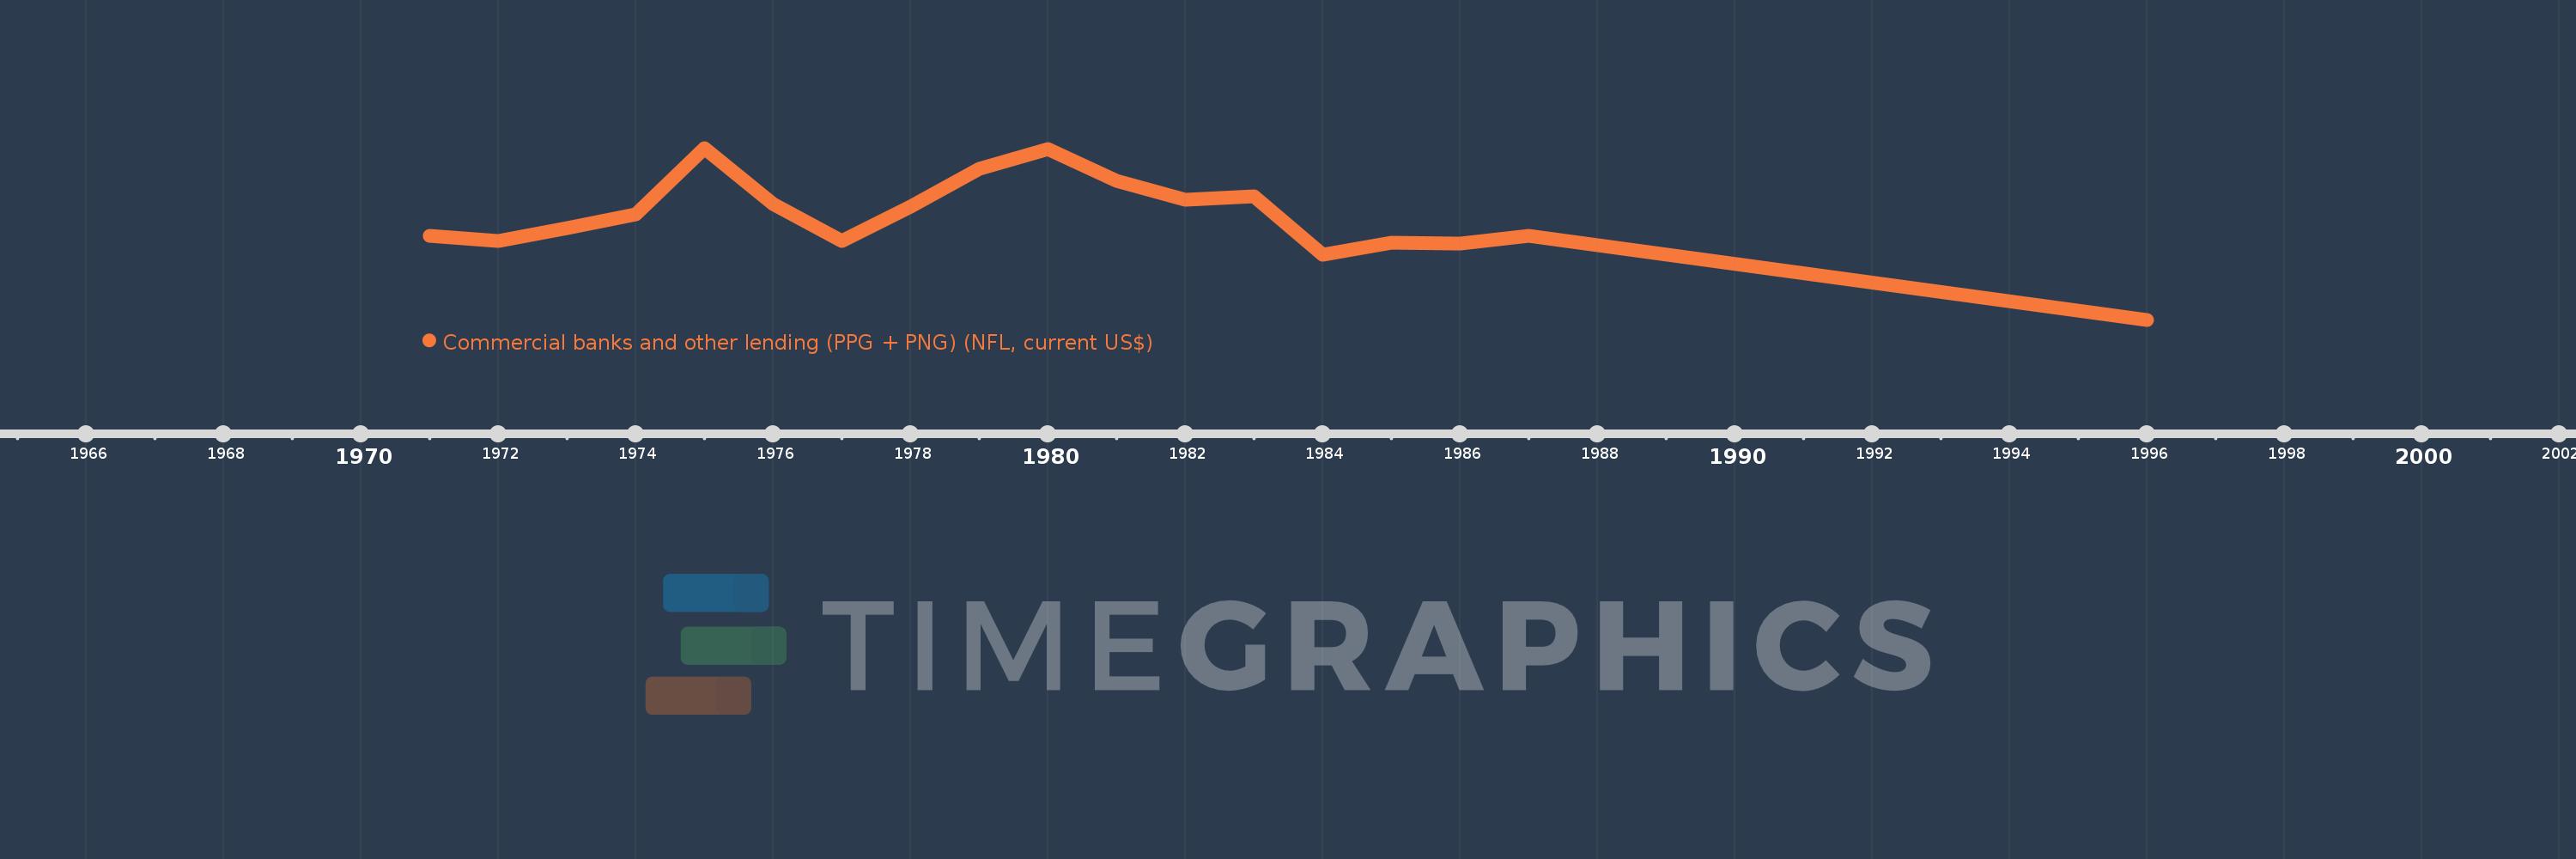
Sierra Leone
SLE
true
2
1
Commercial banks and other lending (PPG + PNG) (NFL, current US$)
1996,1987,1986,1985,1984,1983,1982,1981,1980,1979,1978,1977,1976,1975,1974,1973,1972,1971