Download This statistics in other country:
Timeline:
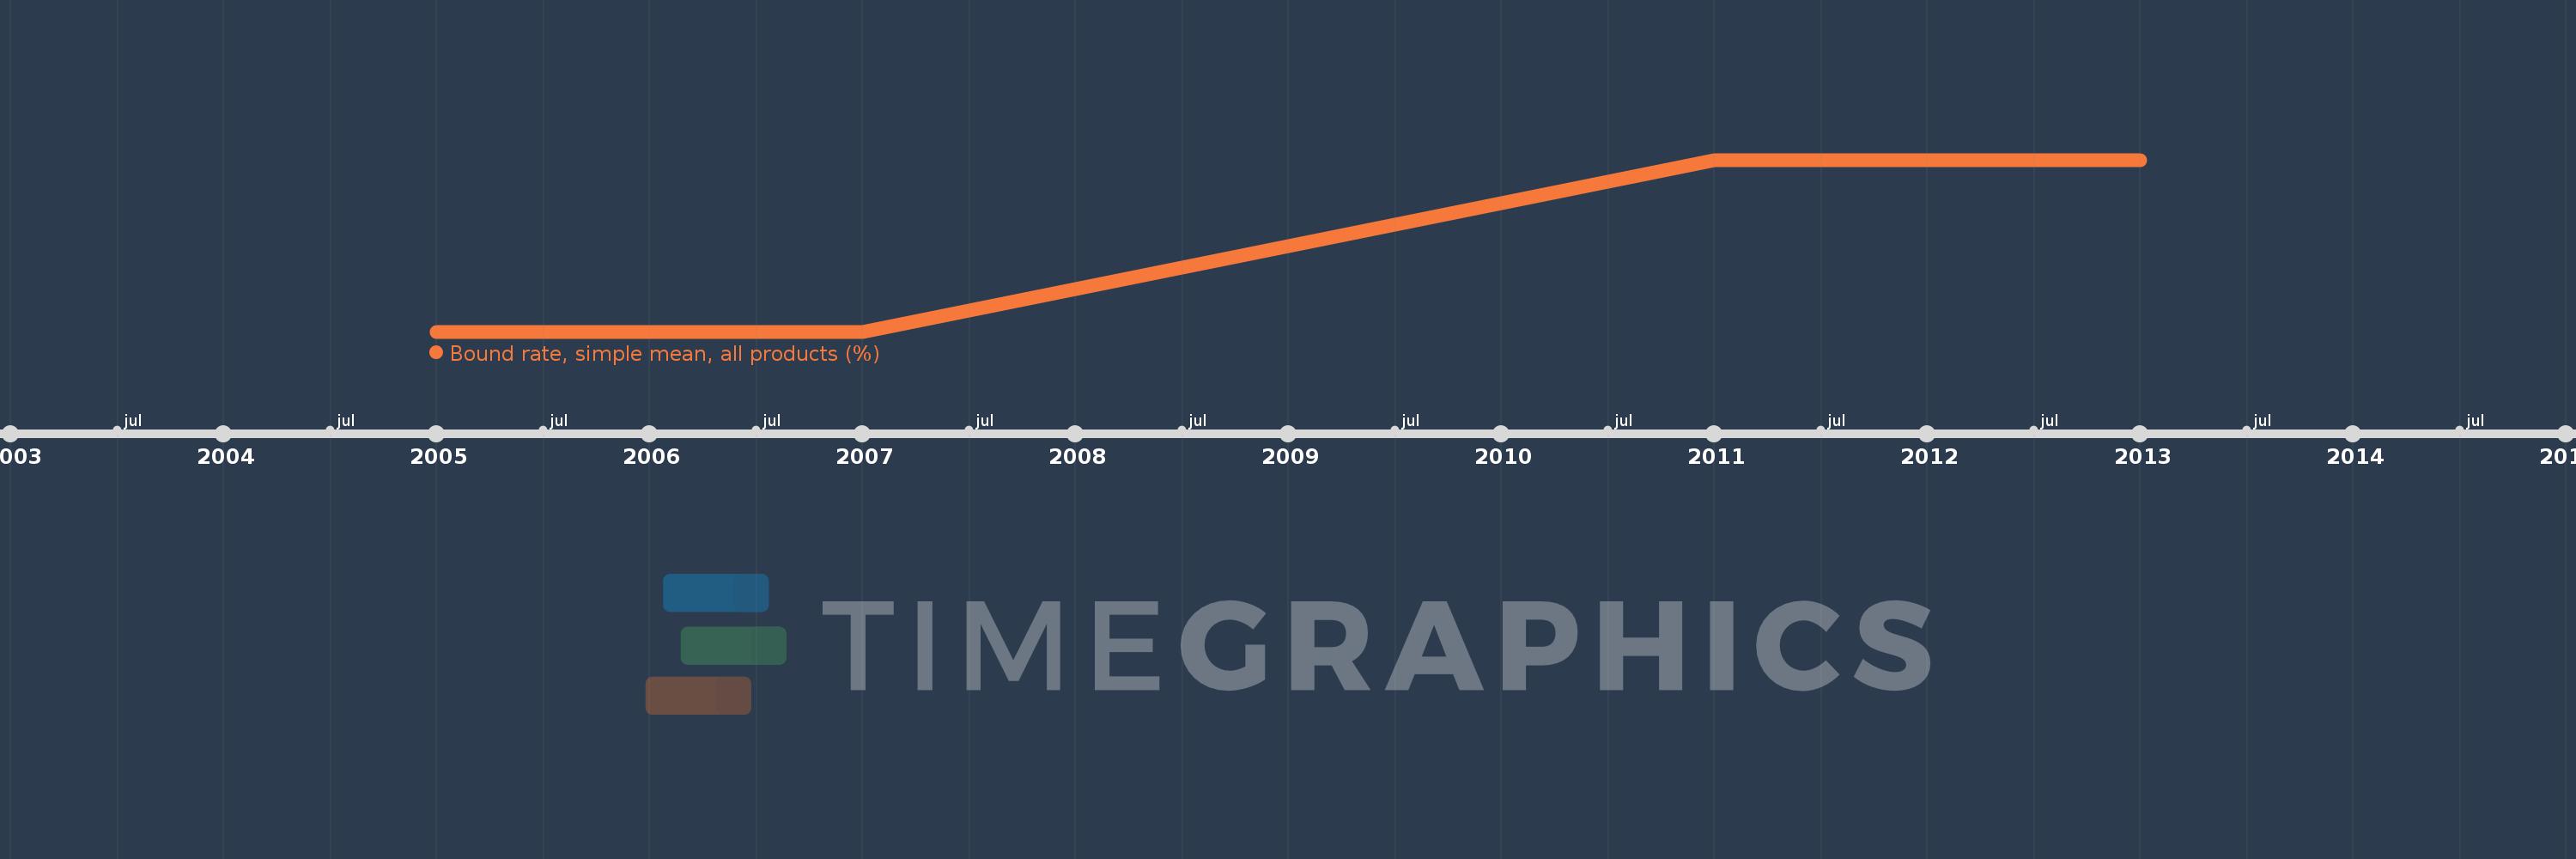
This timeline shows a graph from 2005 to 2013 of Sierra Leone. No data until 2004. Number of actual observations by date: 5.
Source name:
World Development Indicators
Source organization:
World Bank staff estimates using the World Integrated Trade Solution system, based on data from World Trade Organization.
Categories, topics:
Private Sector, Trade
Last updated:
apr 23, 2017
Indicators value changes by year
At the date of observation
Value
Absolute change
Change from the previous value
jan 1, 2005
47.38
+47.38
0.0%
jan 1, 2007
47.38
0.0
0.0%
jan 1, 2011
47.41
+0.03
0.06%
jan 1, 2012
47.41
0.0
0.0%
jan 1, 2013
47.41
0.0
0.0%
Ranking of countries by current statistics by years