33
/
AIzaSyB4mHJ5NPEv-XzF7P6NDYXjlkCWaeKw5bc
November 30, 2025
238731
Seychelles
SYC
true
2
1
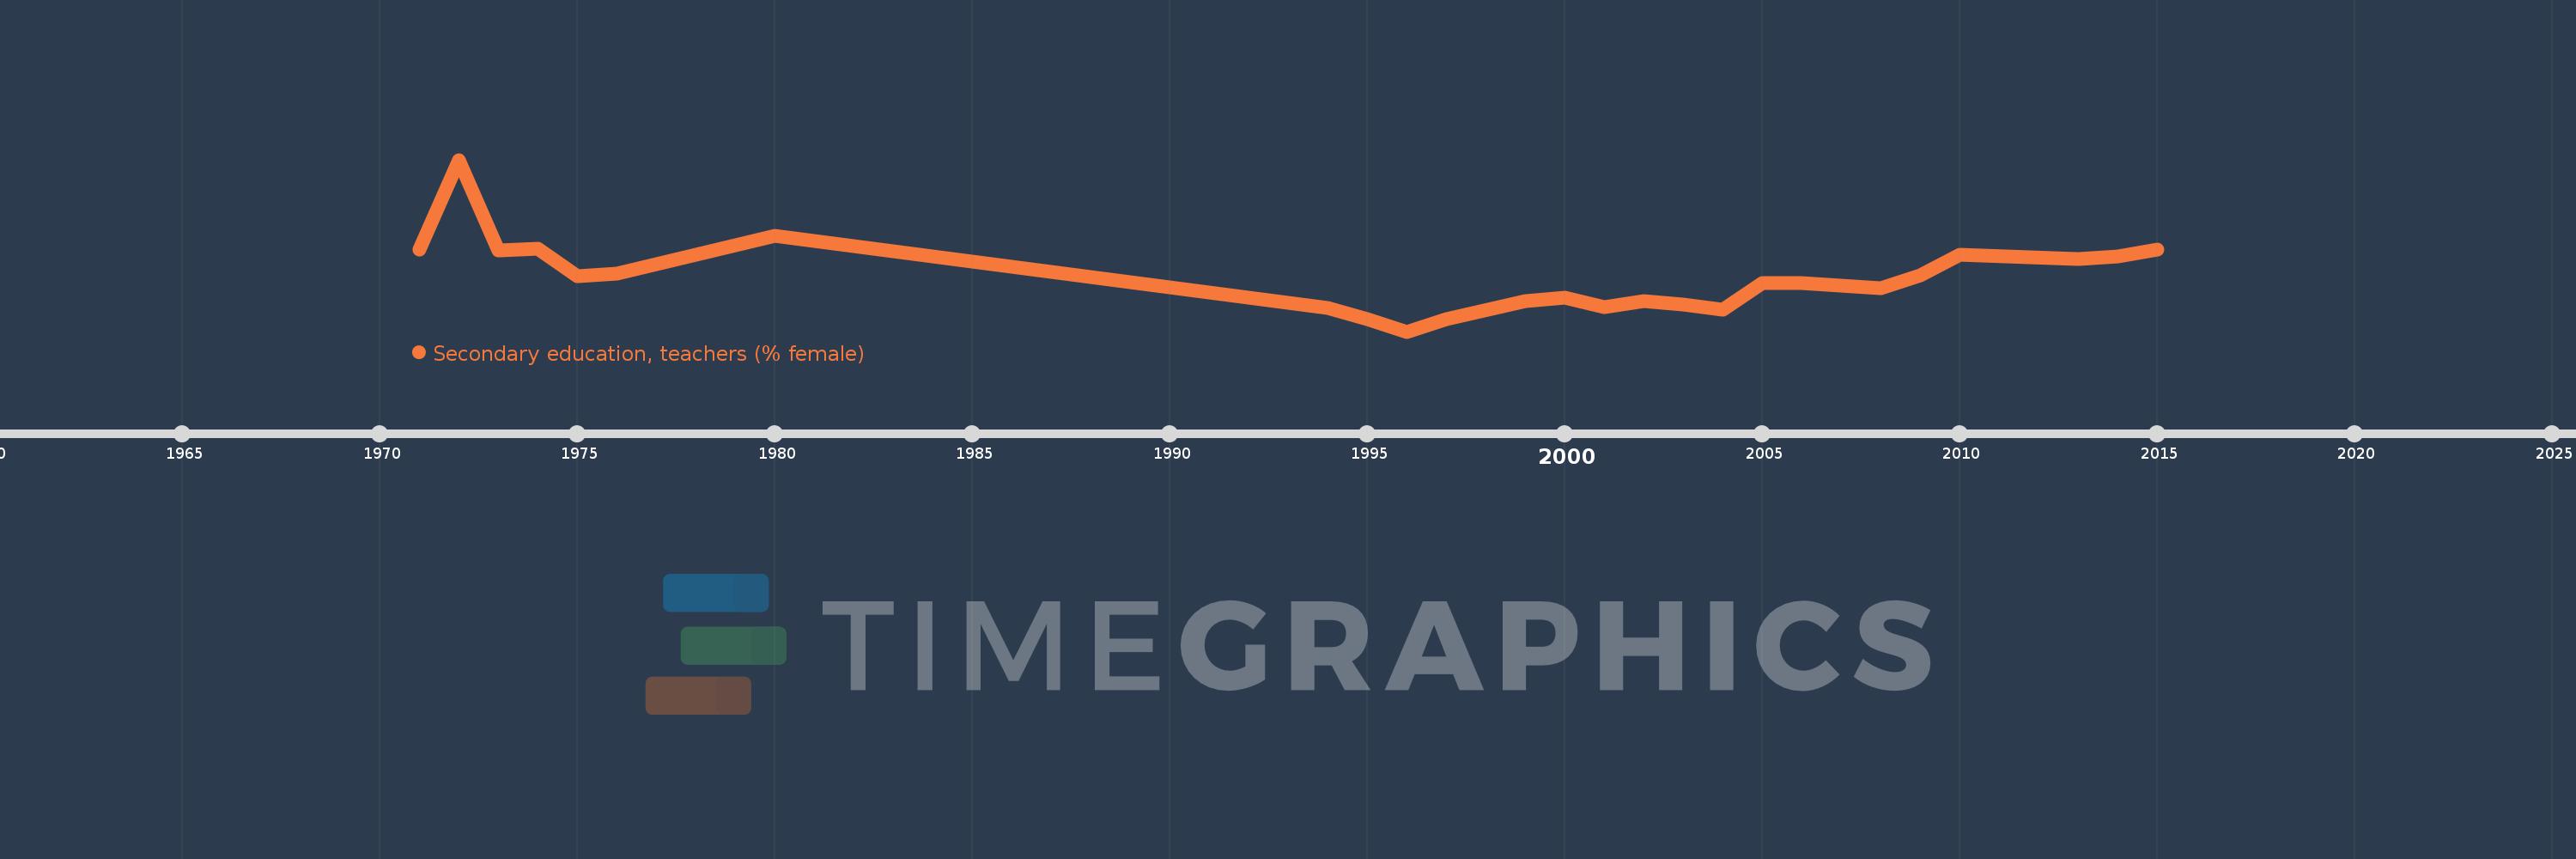
Secondary education, teachers (% female)
2015,2014,2013,2010,2009,2008,2006,2005,2004,2003,2002,2001,2000,1999,1997,1996,1995,1994,1980,1976,1975,1974,1973,1972,1971