33
/
AIzaSyB4mHJ5NPEv-XzF7P6NDYXjlkCWaeKw5bc
November 30, 2025
237676
Serbia
SRB
true
2
1
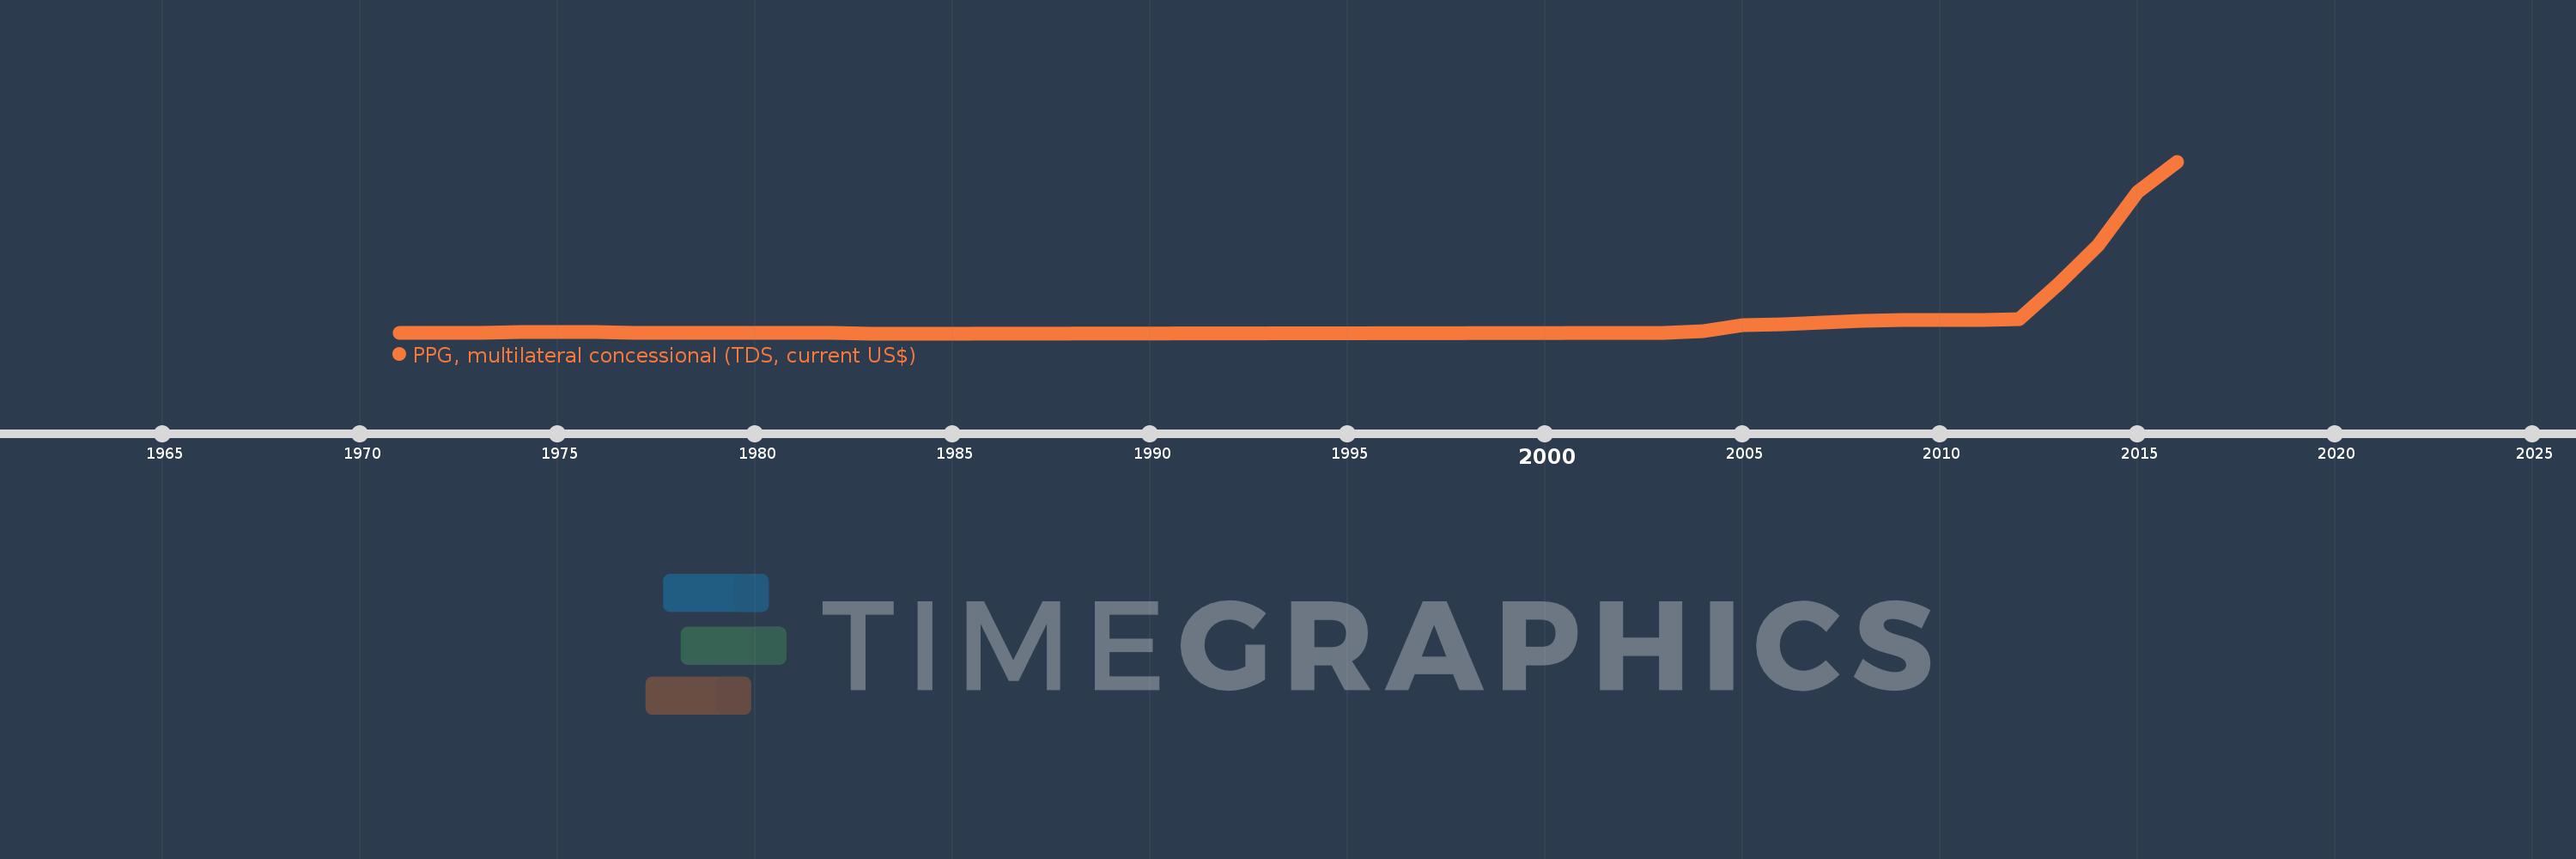
PPG, multilateral concessional (TDS, current US$)
2016,2015,2014,2013,2012,2011,2010,2009,2008,2007,2006,2005,2004,2003,1983,1982,1981,1980,1979,1978,1977,1976,1975,1974,1973,1972,1971