33
/
AIzaSyB4mHJ5NPEv-XzF7P6NDYXjlkCWaeKw5bc
November 30, 2025
237671
Serbia
SRB
true
2
1
PPG, multilateral concessional (DIS, current US$)
2016,2015,2014,2013,2012,2011,2010,2009,2008,2007,2006,2005,2004,2003,2002
Create a timeline
Public Timelines
For education
For educational institutions
For teachers
For students
Cabinet
For educational institutions
For teachers
For students
Open cabinet
FAQ
Close
Create a timeline
Public timelines
FAQ
About & Feedback
Terms
Privacy
FAQ
Support 24/7
Cabinet
Get premium
Donate
Download
Global statistics library
→
Serbia
→
PPG, multilateral concessional (DIS, current US$)
This statistics in other country:
Afghanistan
Albania
Algeria
Angola
Argentina
Armenia
Azerbaijan
Bangladesh
Belarus
Belize
Benin
Bhutan
Bolivia
Bosnia and Herzegovina
Botswana
Brazil
Bulgaria
Burkina Faso
Burundi
Cabo Verde
Cambodia
Cameroon
Central African Republic
Chad
China
Colombia
Comoros
Congo, Dem. Rep.
Congo, Rep.
Costa Rica
Cote d'Ivoire
Djibouti
Dominica
Dominican Republic
East Asia & Pacific (excluding high income)
Ecuador
Egypt, Arab Rep.
El Salvador
Eritrea
Ethiopia
Europe & Central Asia (excluding high income)
Fiji
Gabon
Gambia, The
Georgia
Ghana
Grenada
Guatemala
Guinea
Guinea-Bissau
Guyana
Haiti
Honduras
IDA only
India
Indonesia
Iran, Islamic Rep.
Jamaica
Jordan
Kazakhstan
Kenya
Kosovo
Kyrgyz Republic
Lao PDR
Latin America & Caribbean (excluding high income)
Lebanon
Lesotho
Liberia
Low & middle income
Low income
Lower middle income
Macedonia, FYR
Madagascar
Malawi
Malaysia
Maldives
Mali
Mauritania
Mauritius
Mexico
Middle East & North Africa (excluding high income)
Middle income
Moldova
Mongolia
Montenegro
Morocco
Mozambique
Myanmar
Nepal
Nicaragua
Niger
Nigeria
Pakistan
Panama
Papua New Guinea
Paraguay
Peru
Philippines
Romania
Russian Federation
Rwanda
Samoa
Sao Tome and Principe
Senegal
Serbia
Sierra Leone
Solomon Islands
Somalia
South Asia
Sri Lanka
St. Lucia
St. Vincent and the Grenadines
Sub-Saharan Africa (excluding high income)
Sudan
Swaziland
Syrian Arab Republic
Tajikistan
Tanzania
Thailand
Togo
Tonga
Tunisia
Turkey
Uganda
Ukraine
Upper middle income
Uzbekistan
Vanuatu
Venezuela, RB
Vietnam
Yemen, Rep.
Zambia
Zimbabwe
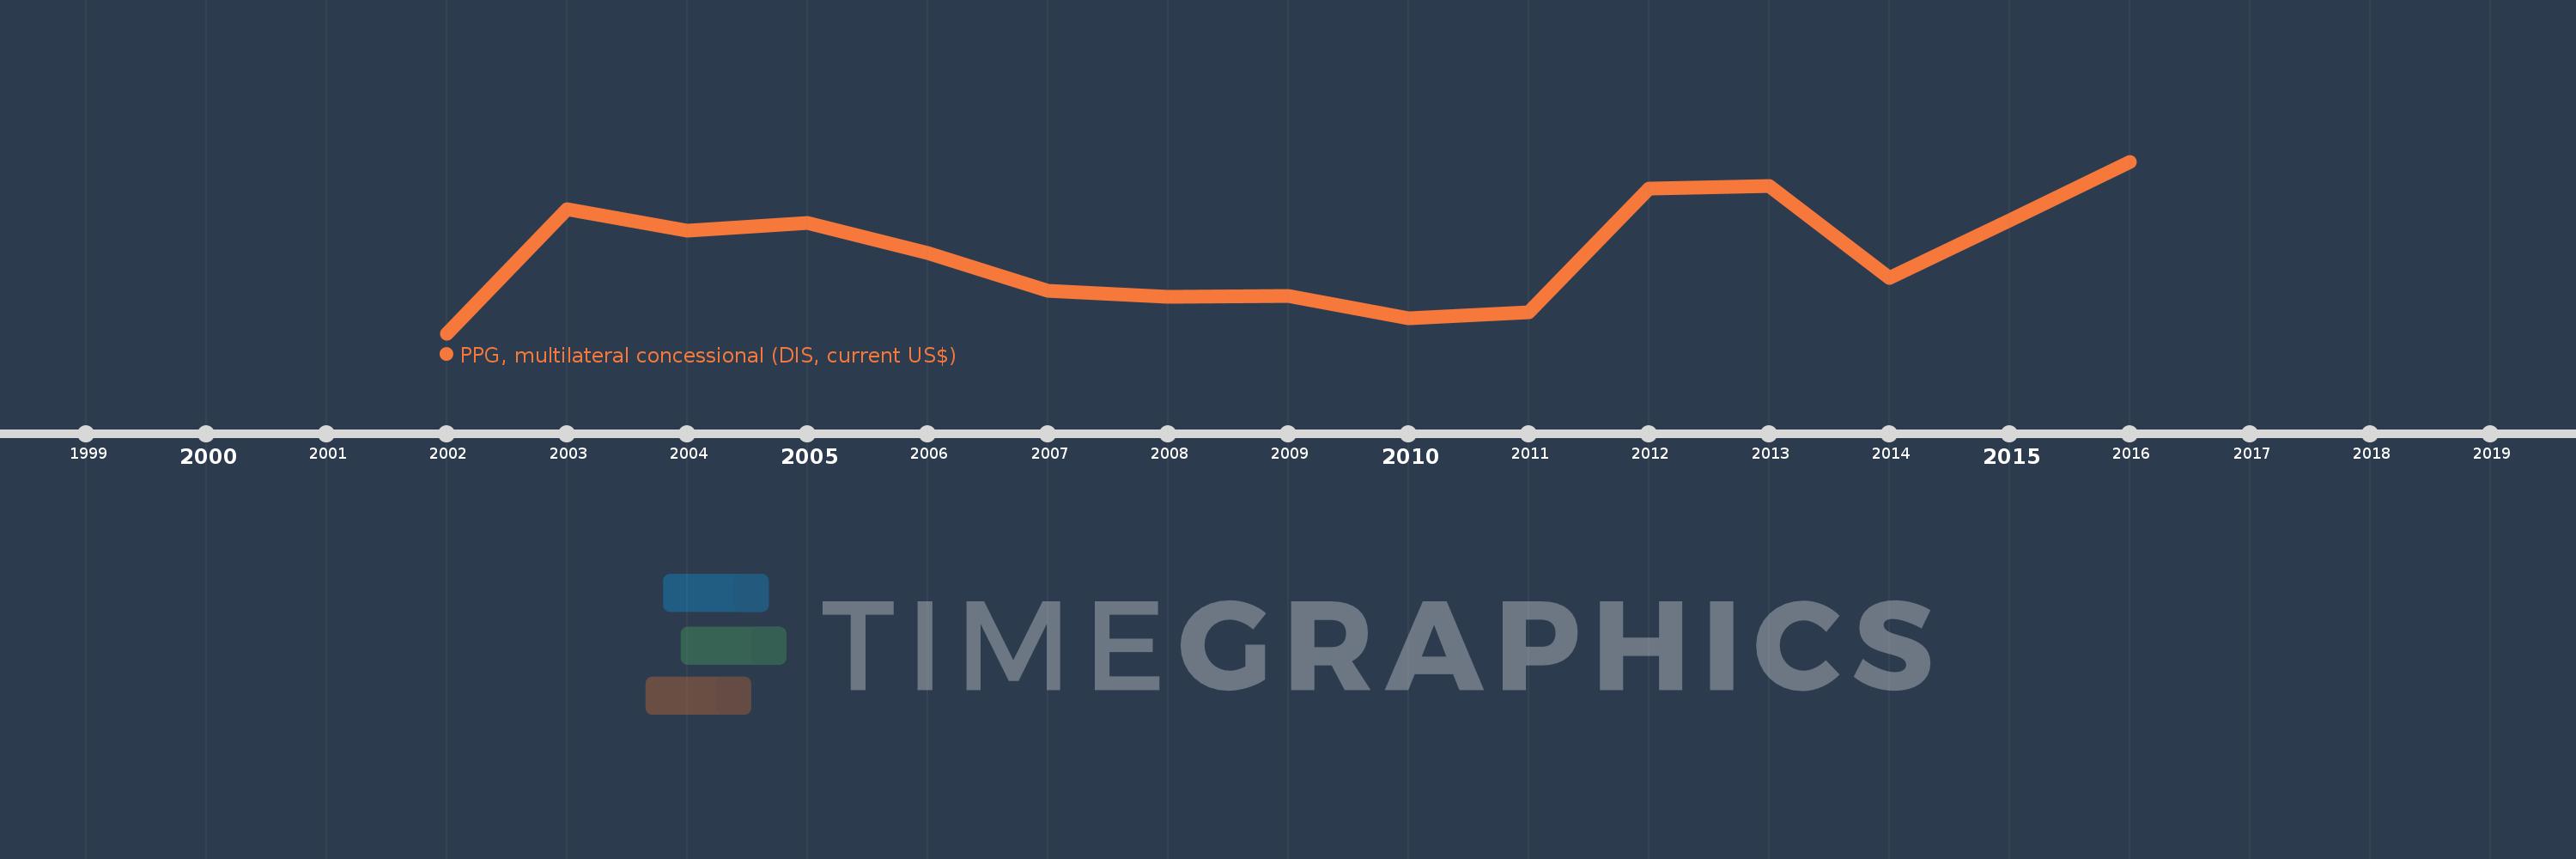
Timeline:
This timeline shows a graph from
2002
to
2016
of Serbia. No data until
2001
. Number of actual observations by date:
15
.
Source name:
World Development Indicators
Source organization:
World Bank, International Debt Statistics.
Categories, topics:
External Debt
Last updated:
apr 23, 2017
Indicators value changes by year
Meaning:
103.14 mln
Minimum:
0.0
jan 1, 2002
Maximum:
221.274 mln
jan 1, 2016
At the date of observation
Value
Absolute change
Change from the previous value
jan 1, 2002
0.0
0.0
0.0%
jan 1, 2003
159.391 mln
+159.391 mln
%
jan 1, 2004
132.175 mln
-27.216 mln
-17.07%
jan 1, 2005
141.765 mln
+9.59 mln
7.26%
jan 1, 2006
103.323 mln
-38.442 mln
-27.12%
jan 1, 2007
54.596 mln
-48.727 mln
-47.16%
jan 1, 2008
47.376 mln
-7.22 mln
-13.22%
jan 1, 2009
47.727 mln
+351.0K
0.74%
jan 1, 2010
19.389 mln
-28.338 mln
-59.38%
jan 1, 2011
26.883 mln
+7.494 mln
38.65%
jan 1, 2012
186.192 mln
+159.309 mln
592.6%
jan 1, 2013
190.15 mln
+3.958 mln
2.13%
jan 1, 2014
71.875 mln
-118.275 mln
-62.2%
jan 1, 2015
144.985 mln
+73.11 mln
101.72%
jan 1, 2016
221.274 mln
+76.289 mln
52.62%
Ranking of countries by current statistics by years
About & Feedback
Terms
Privacy
FAQ
Support 24/7
Cabinet
Get premium
Donate
The service accepts bank transfer (ACH, Wire) or cards (Visa, MasterCard, etc). Processed by Stripe.
Secured with SSL