33
/
AIzaSyB4mHJ5NPEv-XzF7P6NDYXjlkCWaeKw5bc
November 30, 2025
237479
Serbia
SRB
true
2
1
Net financial flows, RDB nonconcessional (NFL, current US$)
2016,2015,2014,2013,2012,2011,2010,2009,2008,2007,2006,2005,2004,2003
Create a timeline
Public Timelines
For education
For educational institutions
For teachers
For students
Cabinet
For educational institutions
For teachers
For students
Open cabinet
FAQ
Close
Create a timeline
Public timelines
FAQ
About & Feedback
Terms
Privacy
FAQ
Support 24/7
Cabinet
Get premium
Donate
Download
Global statistics library
→
Serbia
→
Net financial flows, RDB nonconcessional (NFL, current US$)
This statistics in other country:
Albania
Algeria
Angola
Argentina
Armenia
Azerbaijan
Bangladesh
Belarus
Belize
Benin
Bhutan
Bolivia
Bosnia and Herzegovina
Botswana
Brazil
Bulgaria
Burkina Faso
Burundi
Cabo Verde
Cameroon
Central African Republic
China
Colombia
Comoros
Congo, Dem. Rep.
Congo, Rep.
Costa Rica
Cote d'Ivoire
Dominican Republic
East Asia & Pacific (excluding high income)
Ecuador
Egypt, Arab Rep.
El Salvador
Ethiopia
Europe & Central Asia (excluding high income)
Fiji
Gabon
Gambia, The
Georgia
Ghana
Guatemala
Guinea
Guinea-Bissau
Guyana
Honduras
IDA only
India
Indonesia
Jamaica
Jordan
Kazakhstan
Kenya
Kyrgyz Republic
Lao PDR
Latin America & Caribbean (excluding high income)
Lesotho
Liberia
Low & middle income
Low income
Lower middle income
Macedonia, FYR
Madagascar
Malawi
Malaysia
Mali
Mauritania
Mauritius
Mexico
Middle East & North Africa (excluding high income)
Middle income
Moldova
Mongolia
Montenegro
Morocco
Mozambique
Myanmar
Nepal
Nicaragua
Niger
Nigeria
Pakistan
Panama
Papua New Guinea
Paraguay
Peru
Philippines
Romania
Russian Federation
Rwanda
Senegal
Serbia
Sierra Leone
Somalia
South Africa
South Asia
Sri Lanka
Sub-Saharan Africa (excluding high income)
Sudan
Swaziland
Tajikistan
Tanzania
Thailand
Togo
Tunisia
Turkey
Turkmenistan
Uganda
Ukraine
Upper middle income
Uzbekistan
Venezuela, RB
Vietnam
Zambia
Zimbabwe
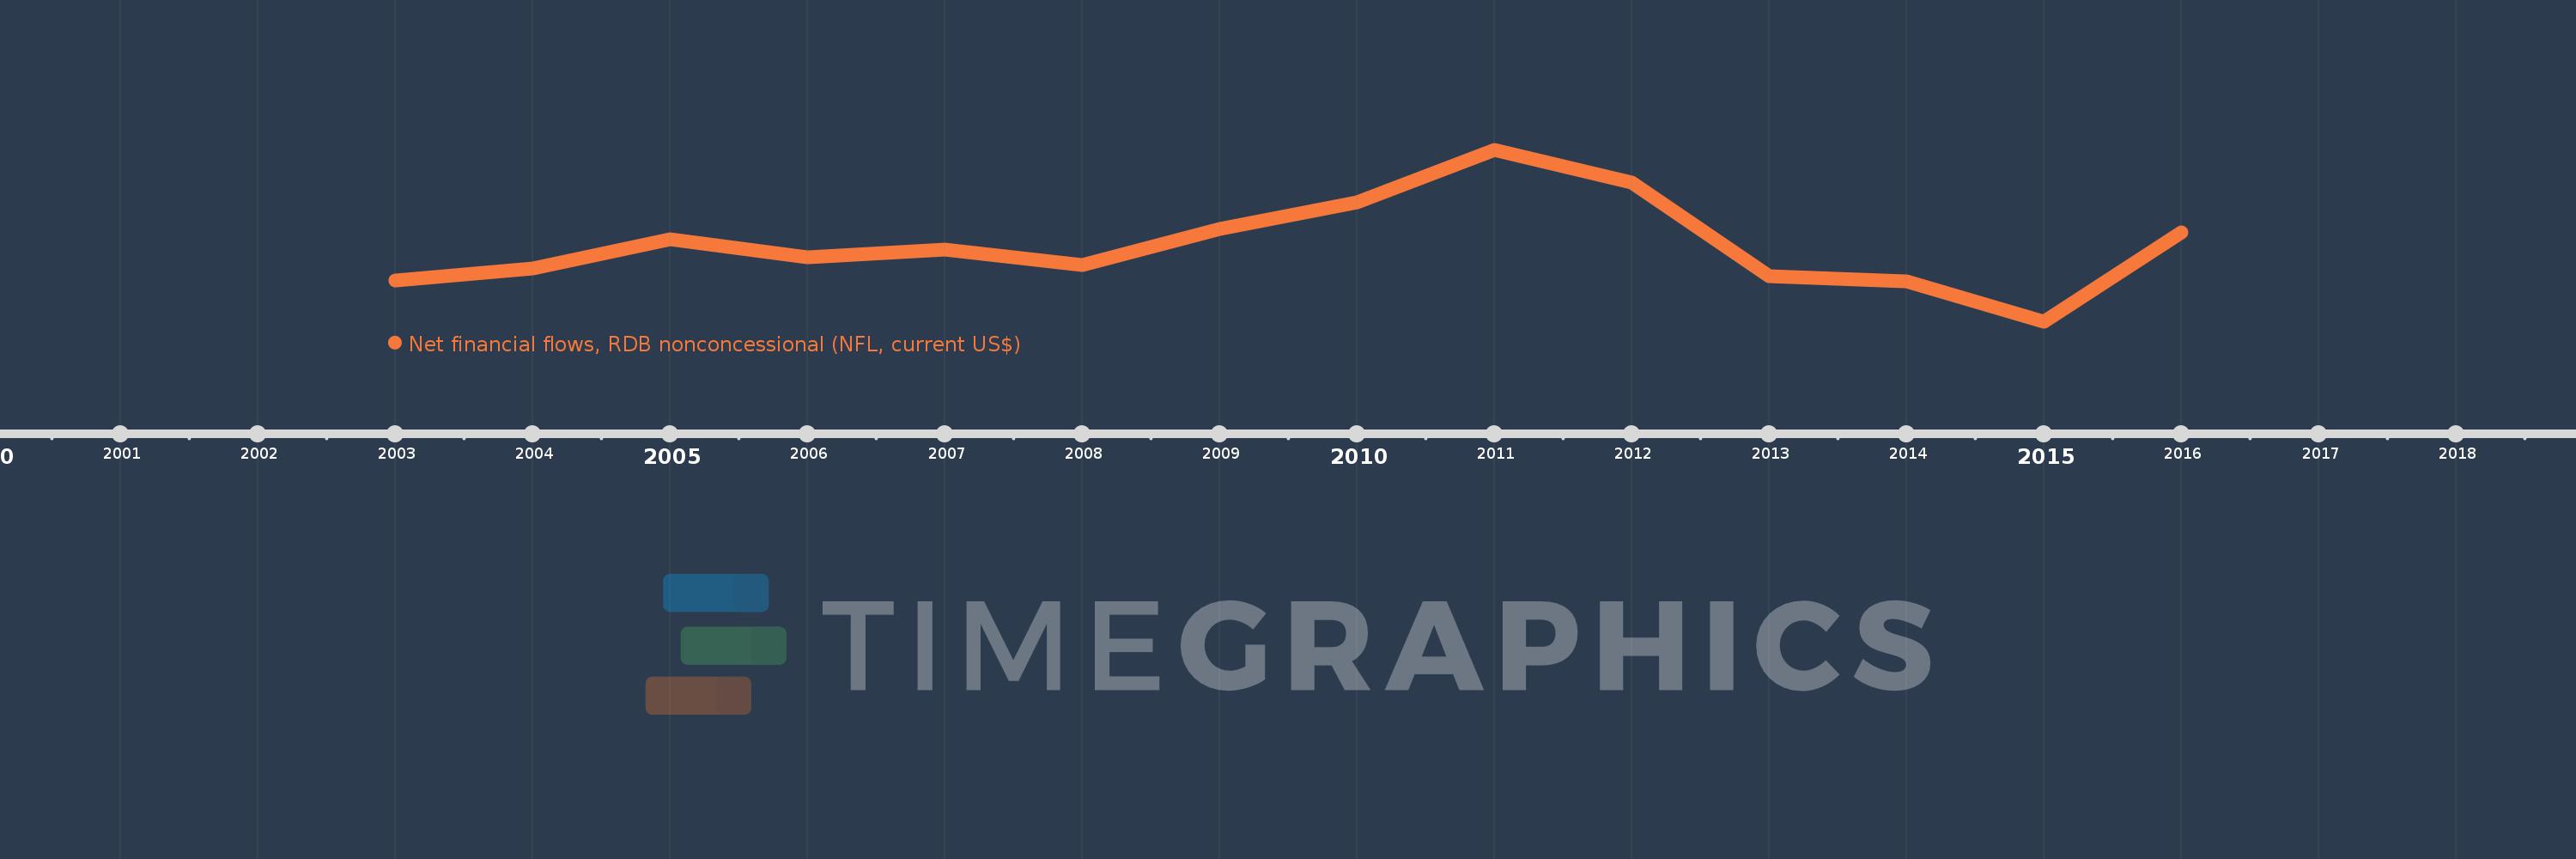
Timeline:
This timeline shows a graph from
2003
to
2016
of Serbia. No data until
2002
. Number of actual observations by date:
14
.
Source name:
World Development Indicators
Source organization:
World Bank, International Debt Statistics.
Categories, topics:
External Debt
Last updated:
apr 23, 2017
Indicators value changes by year
Meaning:
66.457 mln
Minimum:
-44.36 mln
jan 1, 2015
Maximum:
204.437 mln
jan 1, 2011
At the date of observation
Value
Absolute change
Change from the previous value
jan 1, 2003
15.403 mln
+15.403 mln
0.0%
jan 1, 2004
33.189 mln
+17.786 mln
115.47%
jan 1, 2005
75.233 mln
+42.044 mln
126.68%
jan 1, 2006
49.844 mln
-25.389 mln
-33.75%
jan 1, 2007
60.762 mln
+10.918 mln
21.9%
jan 1, 2008
38.659 mln
-22.103 mln
-36.38%
jan 1, 2009
89.925 mln
+51.266 mln
132.61%
jan 1, 2010
128.342 mln
+38.417 mln
42.72%
jan 1, 2011
204.437 mln
+76.095 mln
59.29%
jan 1, 2012
157.282 mln
-47.155 mln
-23.07%
jan 1, 2013
22.501 mln
-134.781 mln
-85.69%
jan 1, 2014
14.078 mln
-8.423 mln
-37.43%
jan 1, 2015
-44.36 mln
-58.438 mln
-415.1%
jan 1, 2016
85.109 mln
+129.469 mln
-291.86%
Ranking of countries by current statistics by years
About & Feedback
Terms
Privacy
FAQ
Support 24/7
Cabinet
Get premium
Donate
The service accepts bank transfer (ACH, Wire) or cards (Visa, MasterCard, etc). Processed by Stripe.
Secured with SSL