33
/
AIzaSyB4mHJ5NPEv-XzF7P6NDYXjlkCWaeKw5bc
November 30, 2025
236241
Senegal
SEN
true
2
1
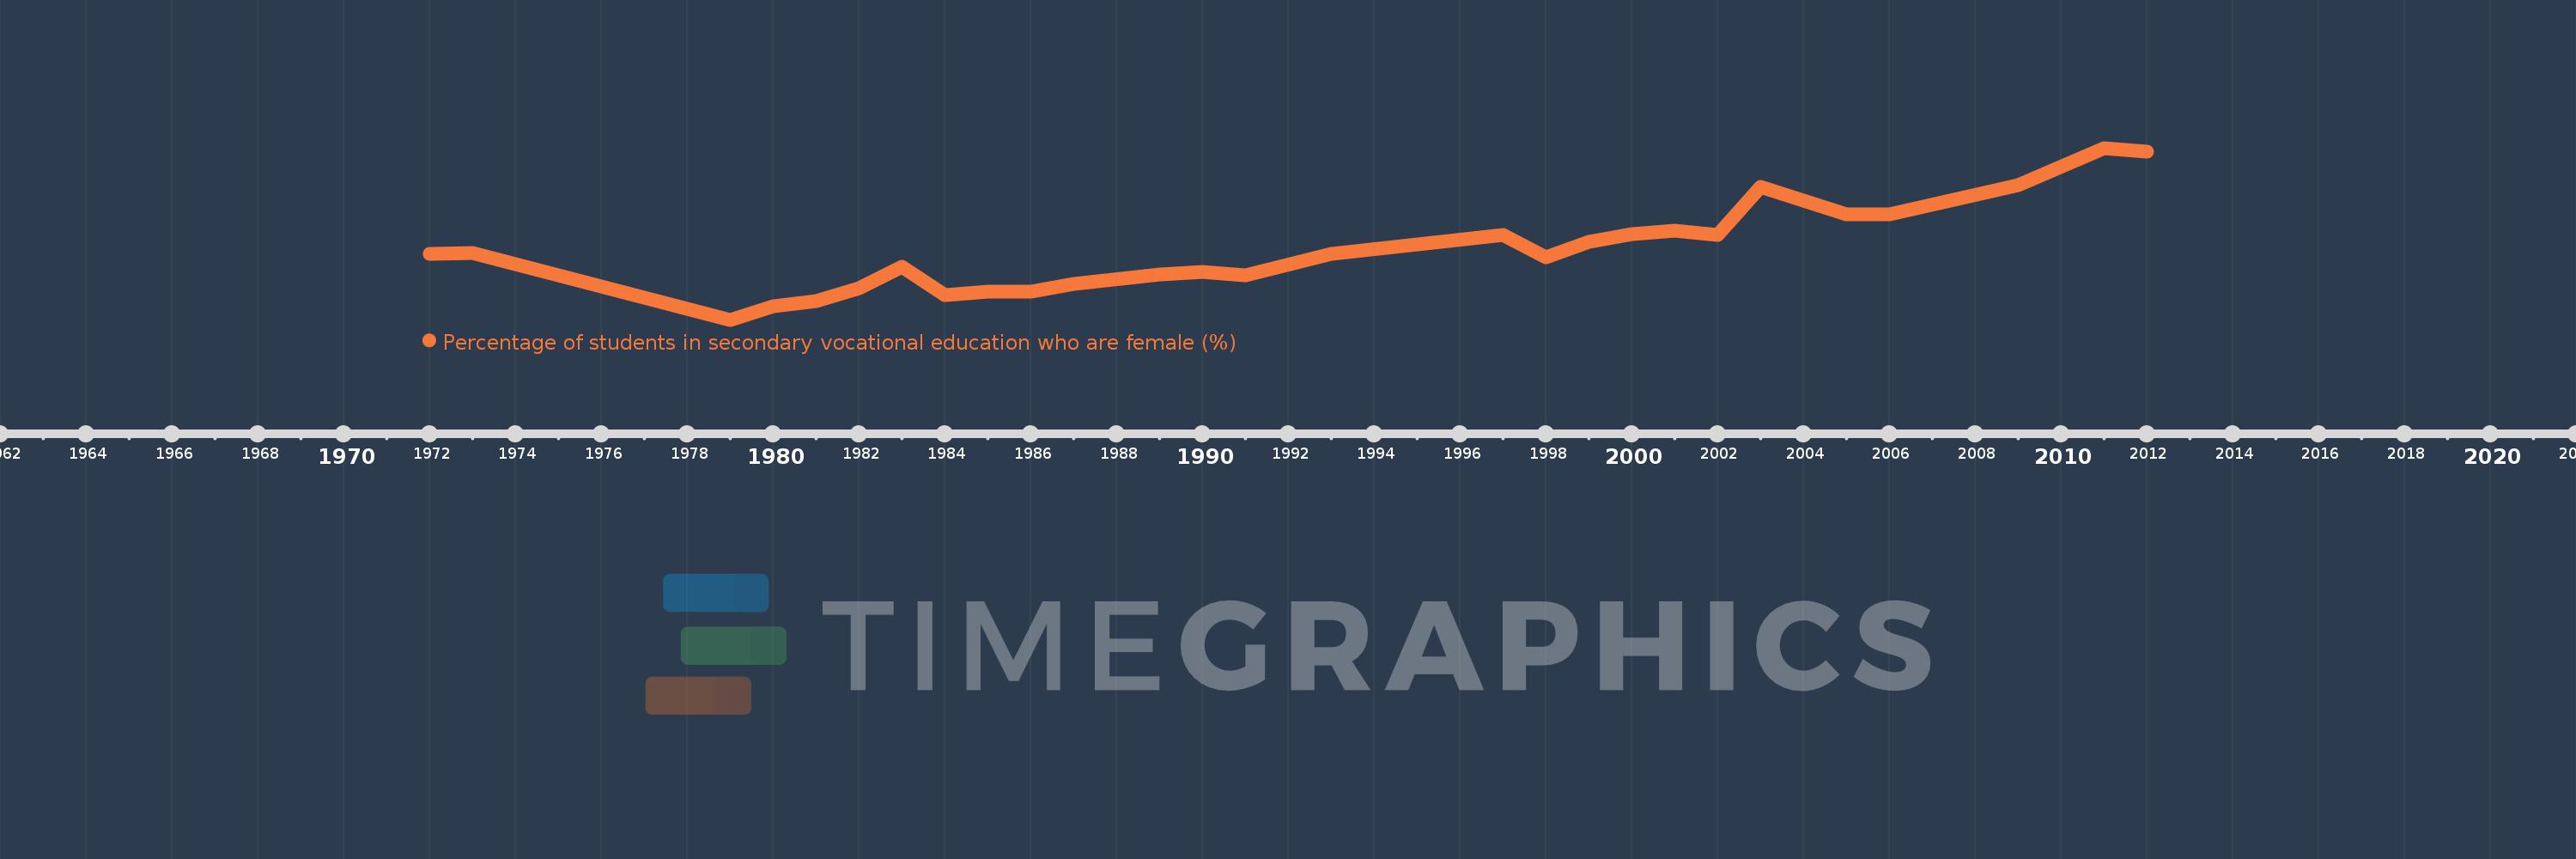
Percentage of students in secondary vocational education who are female (%)
2012,2011,2009,2006,2005,2003,2002,2001,2000,1999,1998,1997,1993,1991,1990,1989,1987,1986,1985,1984,1983,1982,1981,1980,1979,1973,1972