33
/
AIzaSyB4mHJ5NPEv-XzF7P6NDYXjlkCWaeKw5bc
November 30, 2025
236161
Senegal
SEN
true
2
1
Net investment in nonfinancial assets (current LCU)
2013,2012,2011,2010,2002,2001,2000
Create a timeline
Public Timelines
For education
For educational institutions
For teachers
For students
Cabinet
For educational institutions
For teachers
For students
Open cabinet
FAQ
Close
Create a timeline
Public timelines
FAQ
About & Feedback
Terms
Privacy
FAQ
Support 24/7
Cabinet
Get premium
Donate
Download
Global statistics library
→
Senegal
→
Net investment in nonfinancial assets (current LCU)
This statistics in other country:
Afghanistan
Albania
Algeria
Angola
Antigua and Barbuda
Armenia
Australia
Austria
Azerbaijan
Bahamas, The
Bahrain
Bangladesh
Barbados
Belarus
Belgium
Belize
Bhutan
Bolivia
Bosnia and Herzegovina
Brazil
Burundi
Cabo Verde
Cambodia
Canada
Central African Republic
Chile
China
Congo, Dem. Rep.
Congo, Rep.
Costa Rica
Cote d'Ivoire
Croatia
Cyprus
Czech Republic
Denmark
Dominica
Dominican Republic
Egypt, Arab Rep.
El Salvador
Equatorial Guinea
Estonia
Ethiopia
Fiji
Finland
France
Gambia, The
Georgia
Germany
Greece
Guatemala
Honduras
Hungary
Iceland
India
Indonesia
Iran, Islamic Rep.
Iraq
Ireland
Israel
Italy
Jamaica
Kazakhstan
Kiribati
Korea, Rep.
Kyrgyz Republic
Lao PDR
Latvia
Lebanon
Lithuania
Luxembourg
Macao SAR, China
Macedonia, FYR
Madagascar
Malawi
Maldives
Mali
Malta
Mauritius
Mexico
Micronesia, Fed. Sts.
Moldova
Mongolia
Morocco
Mozambique
Namibia
Nepal
Netherlands
New Zealand
Nicaragua
Nigeria
Norway
Oman
Pakistan
Paraguay
Peru
Philippines
Poland
Portugal
Qatar
Romania
Russian Federation
Rwanda
Samoa
San Marino
Sao Tome and Principe
Senegal
Serbia
Sierra Leone
Singapore
Slovak Republic
Solomon Islands
South Africa
Spain
Sri Lanka
Suriname
Swaziland
Sweden
Switzerland
Syrian Arab Republic
Thailand
Timor-Leste
Trinidad and Tobago
Turkey
Uganda
Ukraine
United Arab Emirates
United Kingdom
United States
Uruguay
Vanuatu
Vietnam
West Bank and Gaza
Yemen, Rep.
Zimbabwe
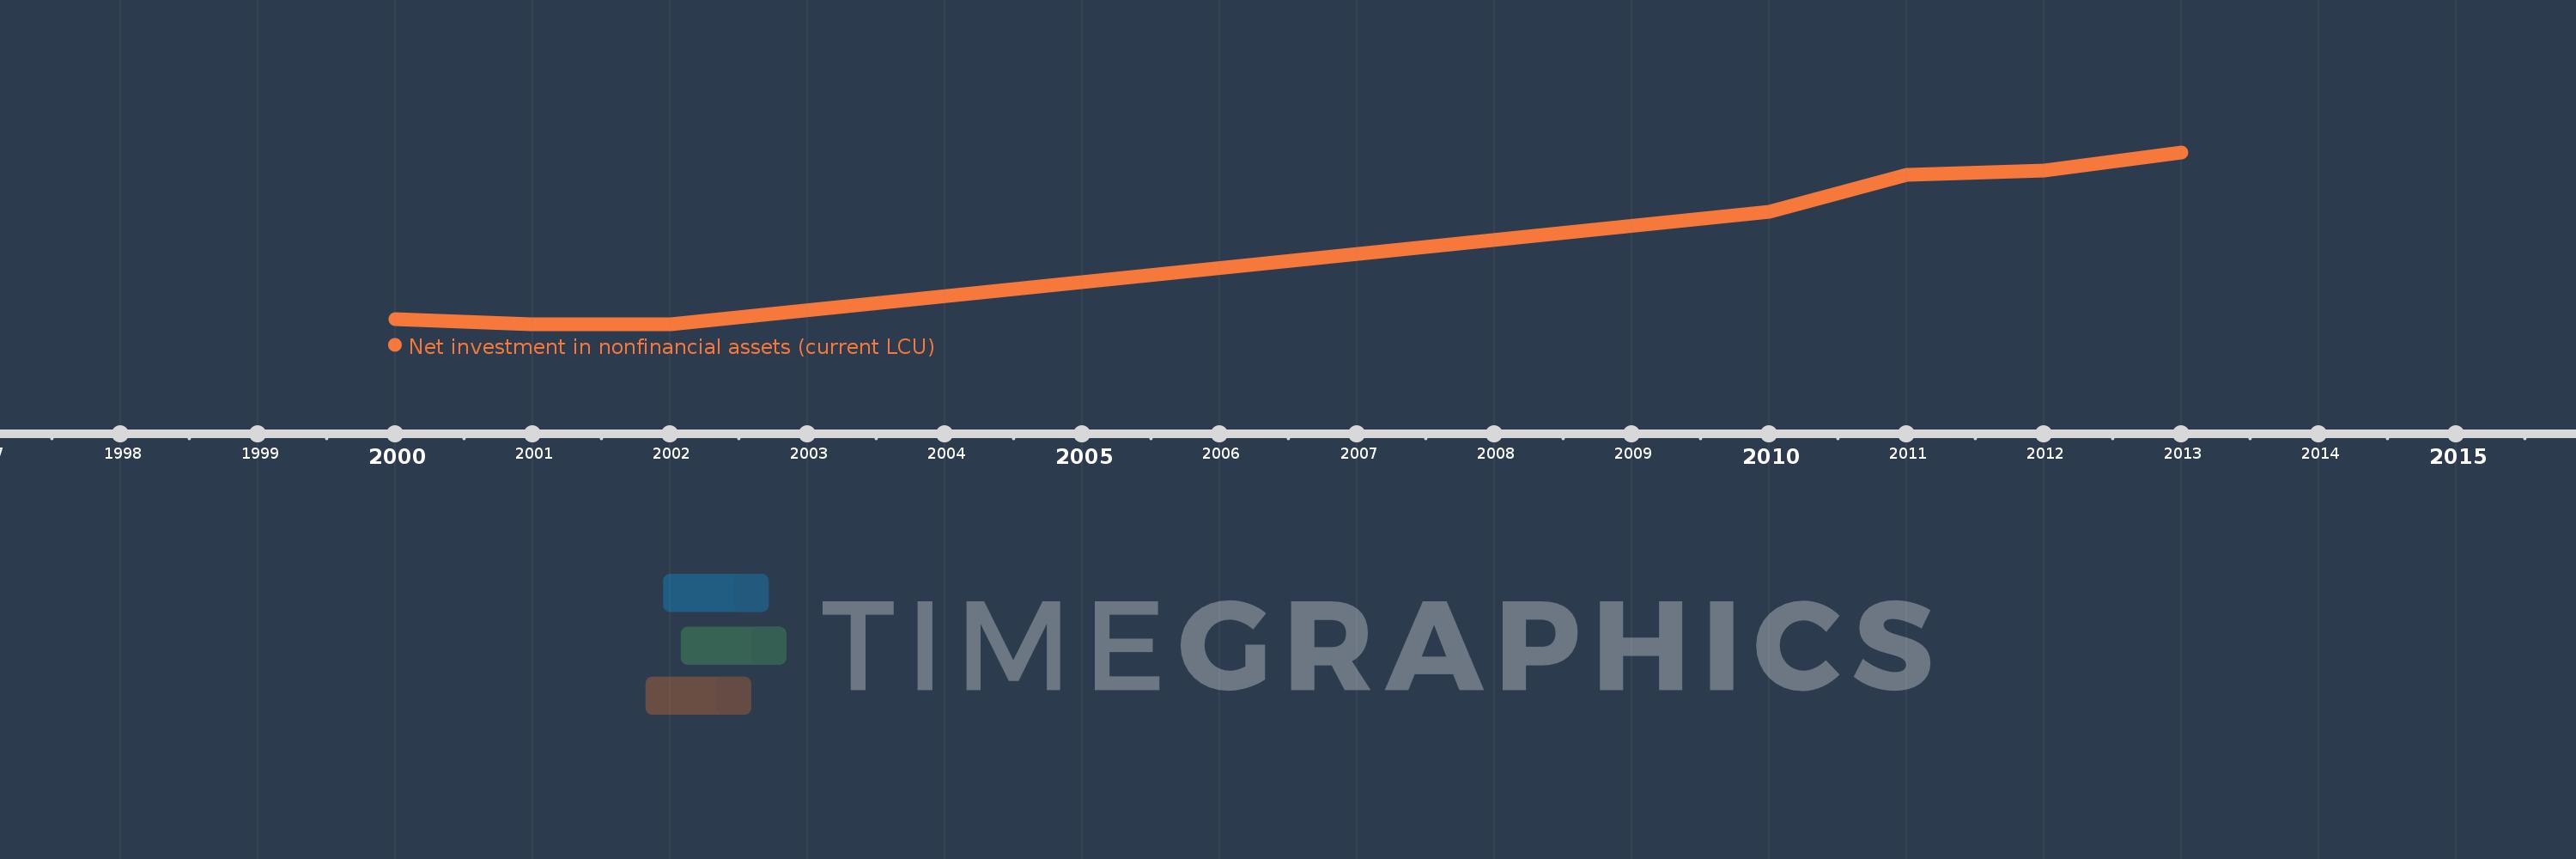
Timeline:
This timeline shows a graph from
2000
to
2013
of Senegal. No data until
1999
. Number of actual observations by date:
7
.
Source name:
World Development Indicators
Source organization:
International Monetary Fund, Government Finance Statistics Yearbook and data files.
Categories, topics:
Public Sector
Last updated:
apr 23, 2017
Indicators value changes by year
Meaning:
511.02 bln
Minimum:
216.1 bln
jan 1, 2001
Maximum:
814.4 bln
jan 1, 2013
At the date of observation
Value
Absolute change
Change from the previous value
jan 1, 2000
234.5 bln
+234.5 bln
0.0%
jan 1, 2001
216.1 bln
-18.4 bln
-7.85%
jan 1, 2002
217.2 bln
+1.1 bln
0.51%
jan 1, 2010
606.9 bln
+389.7 bln
179.42%
jan 1, 2011
735.637 bln
+128.737 bln
21.21%
jan 1, 2012
752.4 bln
+16.763 bln
2.28%
jan 1, 2013
814.4 bln
+62.0 bln
8.24%
Ranking of countries by current statistics by years
About & Feedback
Terms
Privacy
FAQ
Support 24/7
Cabinet
Get premium
Donate
The service accepts bank transfer (ACH, Wire) or cards (Visa, MasterCard, etc). Processed by Stripe.
Secured with SSL