33
/
AIzaSyB4mHJ5NPEv-XzF7P6NDYXjlkCWaeKw5bc
November 30, 2025
234104
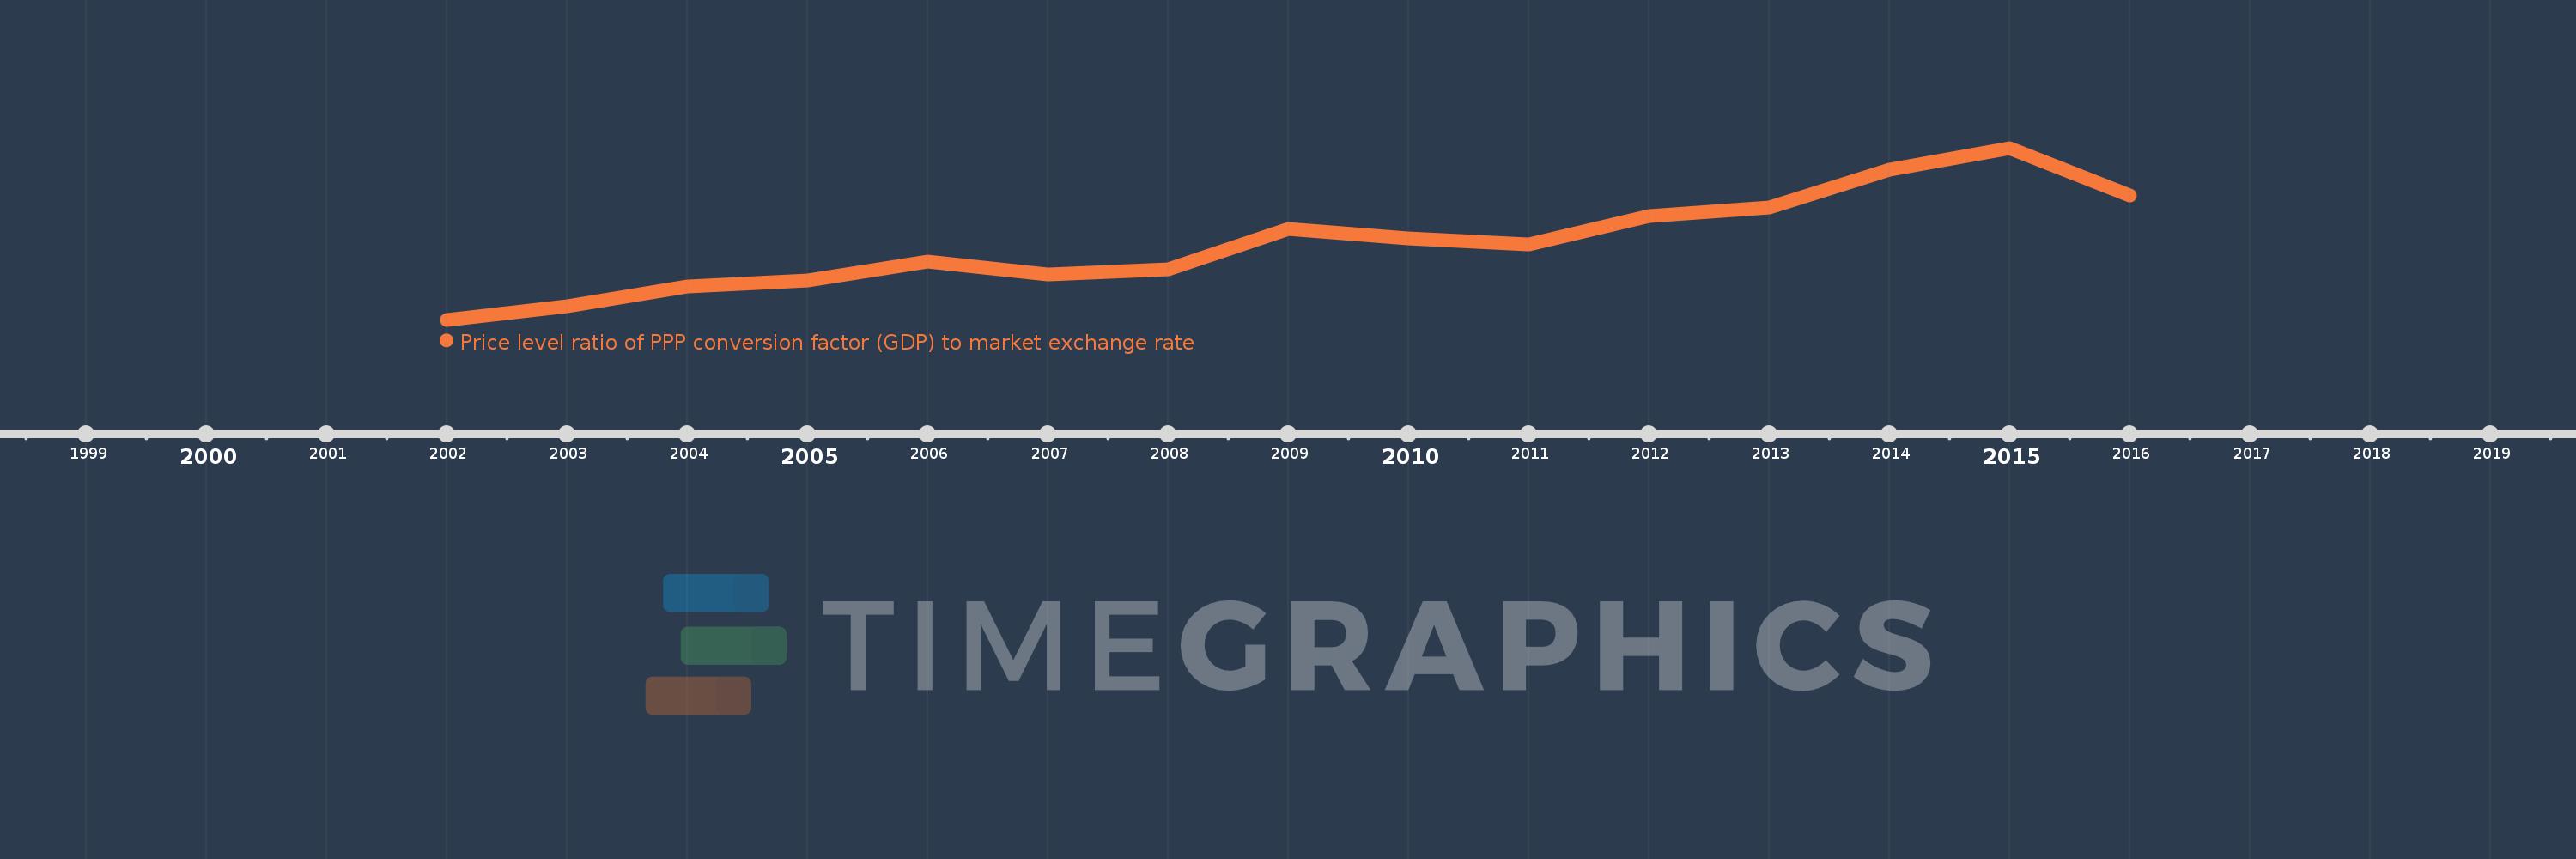
Sao Tome and Principe
STP
true
2
1
Price level ratio of PPP conversion factor (GDP) to market exchange rate
2016,2015,2014,2013,2012,2011,2010,2009,2008,2007,2006,2005,2004,2003,2002