33
/
AIzaSyB4mHJ5NPEv-XzF7P6NDYXjlkCWaeKw5bc
November 30, 2025
230186
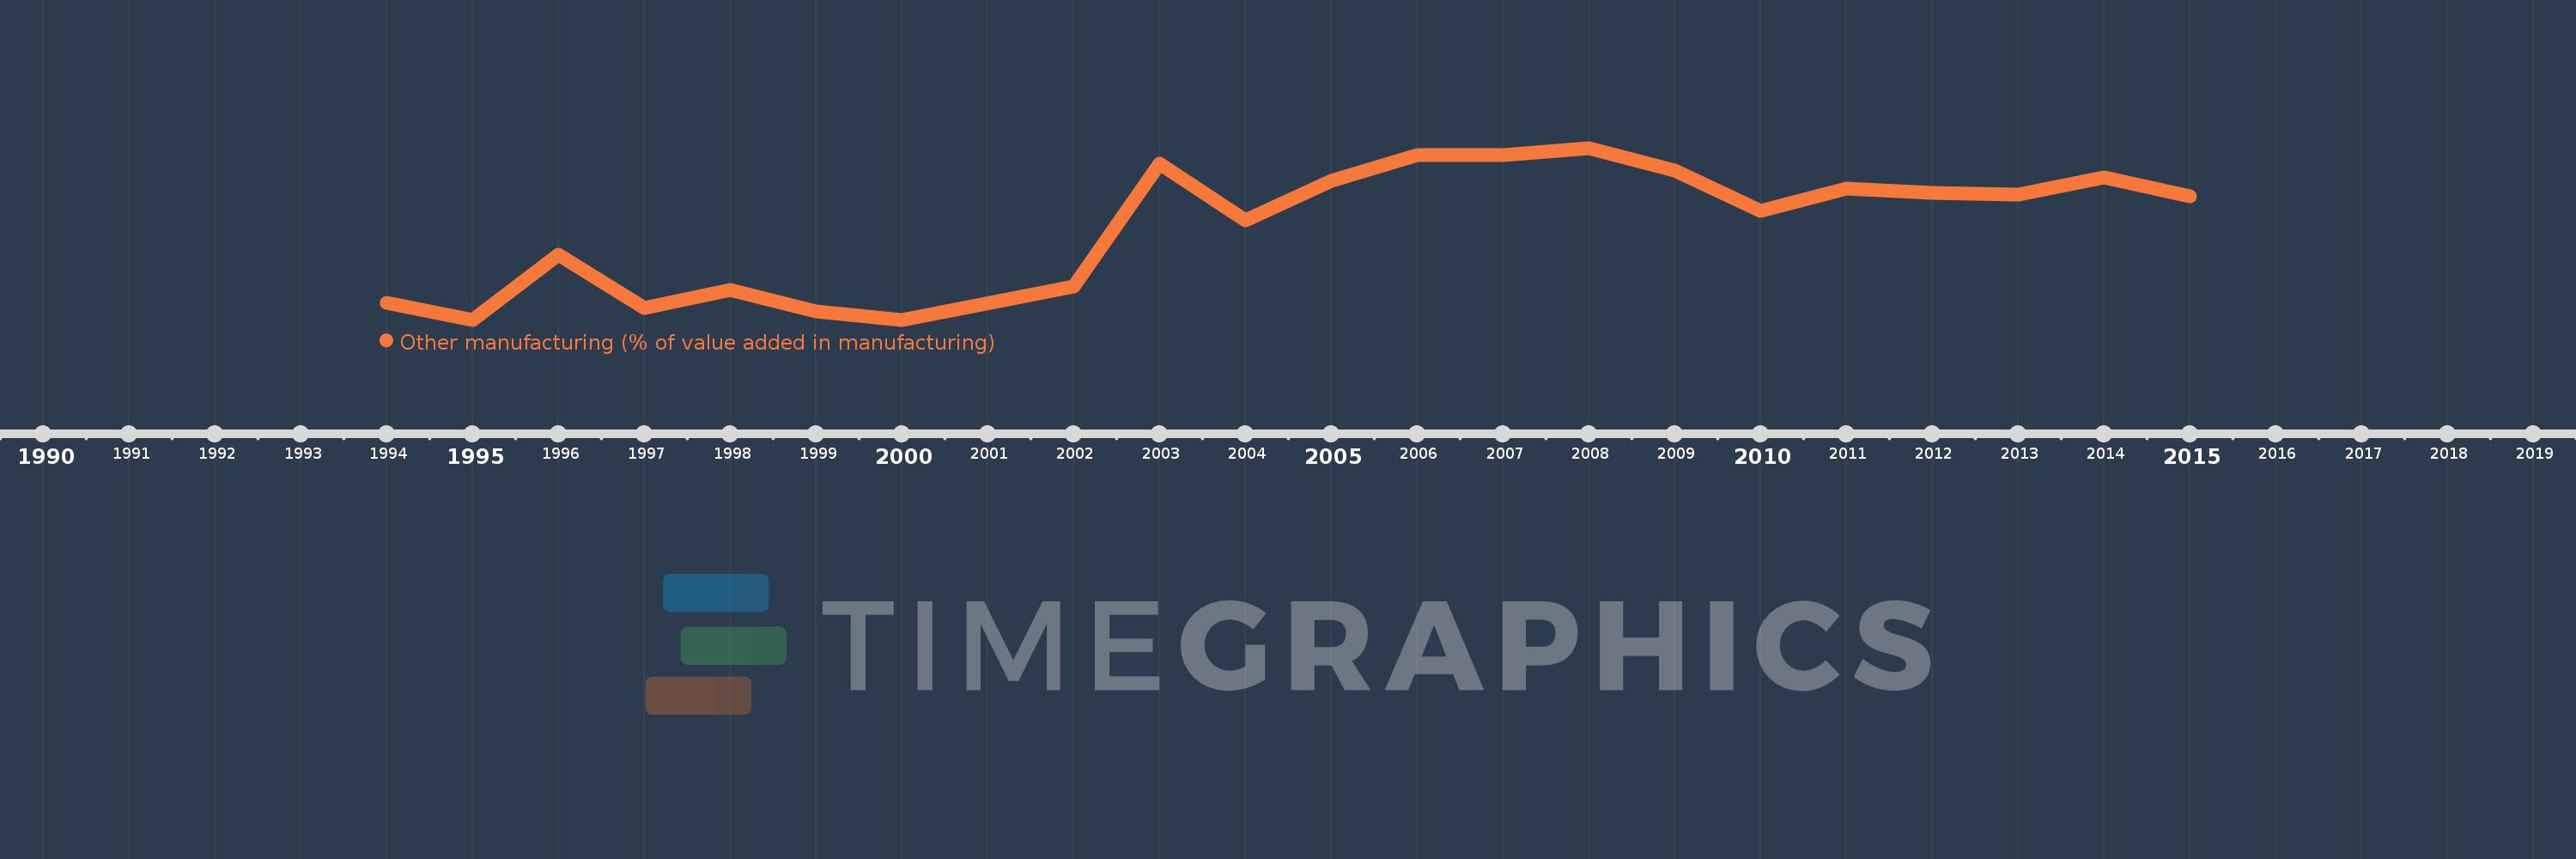
Russian Federation
RUS
true
2
1
Other manufacturing (% of value added in manufacturing)
2015,2014,2013,2012,2011,2010,2009,2008,2007,2006,2005,2004,2003,2002,2000,1999,1998,1997,1996,1995,1994