33
/
AIzaSyB4mHJ5NPEv-XzF7P6NDYXjlkCWaeKw5bc
November 1, 2025
229014
Romania
ROU
true
2
1
PPG, bonds (NTR, current US$)
2016,2015,2014,2013,2012,2011,2010,2009,2008,2007,2006,2005,2004,2003,2002,2001,2000,1999,1998,1997
Create a timeline
Public Timelines
For education
For educational institutions
For teachers
For students
Cabinet
For educational institutions
For teachers
For students
Open cabinet
FAQ
Get premium
Close
Create a timeline
Public timelines
FAQ
About & Feedback
Terms
Privacy
FAQ
Support 24/7
Cabinet
Get premium
Donate
Download
Global statistics library
→
Romania
→
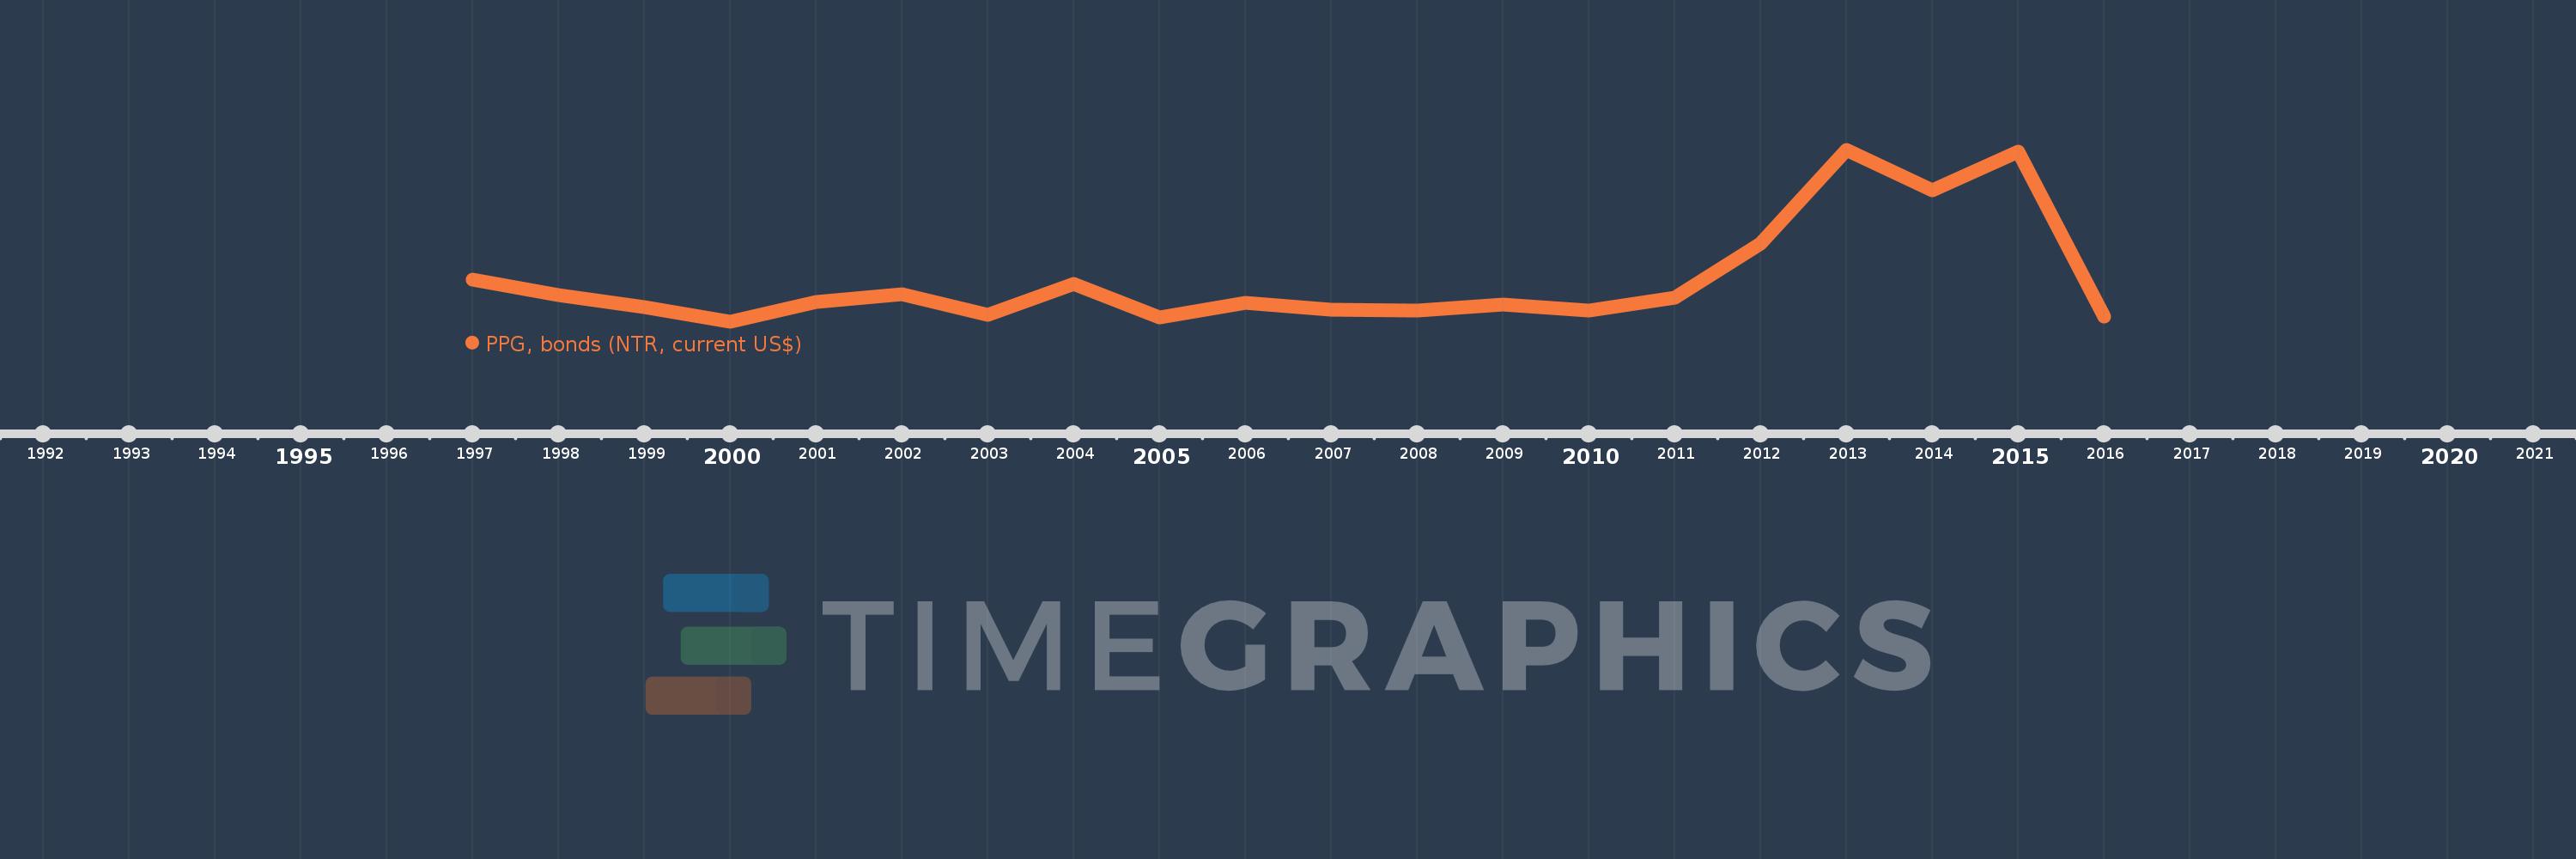
PPG, bonds (NTR, current US$)
This statistics in other country:
Albania
Algeria
Angola
Argentina
Armenia
Azerbaijan
Belarus
Belize
Benin
Bolivia
Bosnia and Herzegovina
Botswana
Brazil
Bulgaria
Burkina Faso
Cameroon
China
Colombia
Congo, Dem. Rep.
Congo, Rep.
Costa Rica
Cote d'Ivoire
Dominica
Dominican Republic
East Asia & Pacific (excluding high income)
Ecuador
Egypt, Arab Rep.
El Salvador
Ethiopia
Europe & Central Asia (excluding high income)
Fiji
Gabon
Georgia
Ghana
Grenada
Guatemala
Guinea
Guyana
Honduras
IDA only
India
Indonesia
Jamaica
Jordan
Kazakhstan
Kenya
Lao PDR
Latin America & Caribbean (excluding high income)
Lebanon
Low & middle income
Low income
Lower middle income
Macedonia, FYR
Malawi
Malaysia
Mauritania
Mauritius
Mexico
Middle East & North Africa (excluding high income)
Middle income
Moldova
Mongolia
Montenegro
Morocco
Mozambique
Nicaragua
Niger
Nigeria
Pakistan
Panama
Papua New Guinea
Paraguay
Peru
Philippines
Romania
Russian Federation
Rwanda
Samoa
Senegal
Serbia
Sierra Leone
South Africa
South Asia
Sri Lanka
St. Lucia
St. Vincent and the Grenadines
Sub-Saharan Africa (excluding high income)
Sudan
Thailand
Togo
Tunisia
Turkey
Uganda
Ukraine
Upper middle income
Venezuela, RB
Vietnam
Zambia
Zimbabwe
Timeline:
This timeline shows a graph from
1997
to
2016
of Romania. No data until
1996
. Number of actual observations by date:
20
.
Source name:
World Development Indicators
Source organization:
World Bank, International Debt Statistics.
Categories, topics:
External Debt
Last updated:
apr 23, 2017
Indicators value changes by year
Meaning:
768.774 mln
Minimum:
-510.819 mln
jan 1, 2000
Maximum:
4.755 bln
jan 1, 2013
At the date of observation
Value
Absolute change
Change from the previous value
jan 1, 1997
795.708 mln
+795.708 mln
0.0%
jan 1, 1998
307.67 mln
-488.038 mln
-61.33%
jan 1, 1999
-62.955 mln
-370.625 mln
-120.46%
jan 1, 2000
-510.819 mln
-447.864 mln
711.4%
jan 1, 2001
93.153 mln
+603.972 mln
-118.24%
jan 1, 2002
326.512 mln
+233.359 mln
250.51%
jan 1, 2003
-279.241 mln
-605.753 mln
-185.52%
jan 1, 2004
660.6 mln
+939.841 mln
-336.57%
jan 1, 2005
-379.791 mln
-1.04 bln
-157.49%
jan 1, 2006
65.402 mln
+445.193 mln
-117.22%
jan 1, 2007
-130.588 mln
-195.99 mln
-299.67%
jan 1, 2008
-170.815 mln
-40.227 mln
30.8%
jan 1, 2009
21.339 mln
+192.154 mln
-112.49%
jan 1, 2010
-155.819 mln
-177.158 mln
-830.21%
jan 1, 2011
242.159 mln
+397.978 mln
-255.41%
jan 1, 2012
1.899 bln
+1.657 bln
684.22%
jan 1, 2013
4.755 bln
+2.856 bln
150.41%
jan 1, 2014
3.537 bln
-1.218 bln
-25.61%
jan 1, 2015
4.708 bln
+1.17 bln
33.09%
jan 1, 2016
-346.787 mln
-5.055 bln
-107.37%
Ranking of countries by current statistics by years
About & Feedback
Terms
Privacy
FAQ
Support 24/7
Cabinet
Get premium
Donate
The service accepts bank transfer (ACH, Wire) or cards (Visa, MasterCard, etc). Processed by Stripe.
Secured with SSL