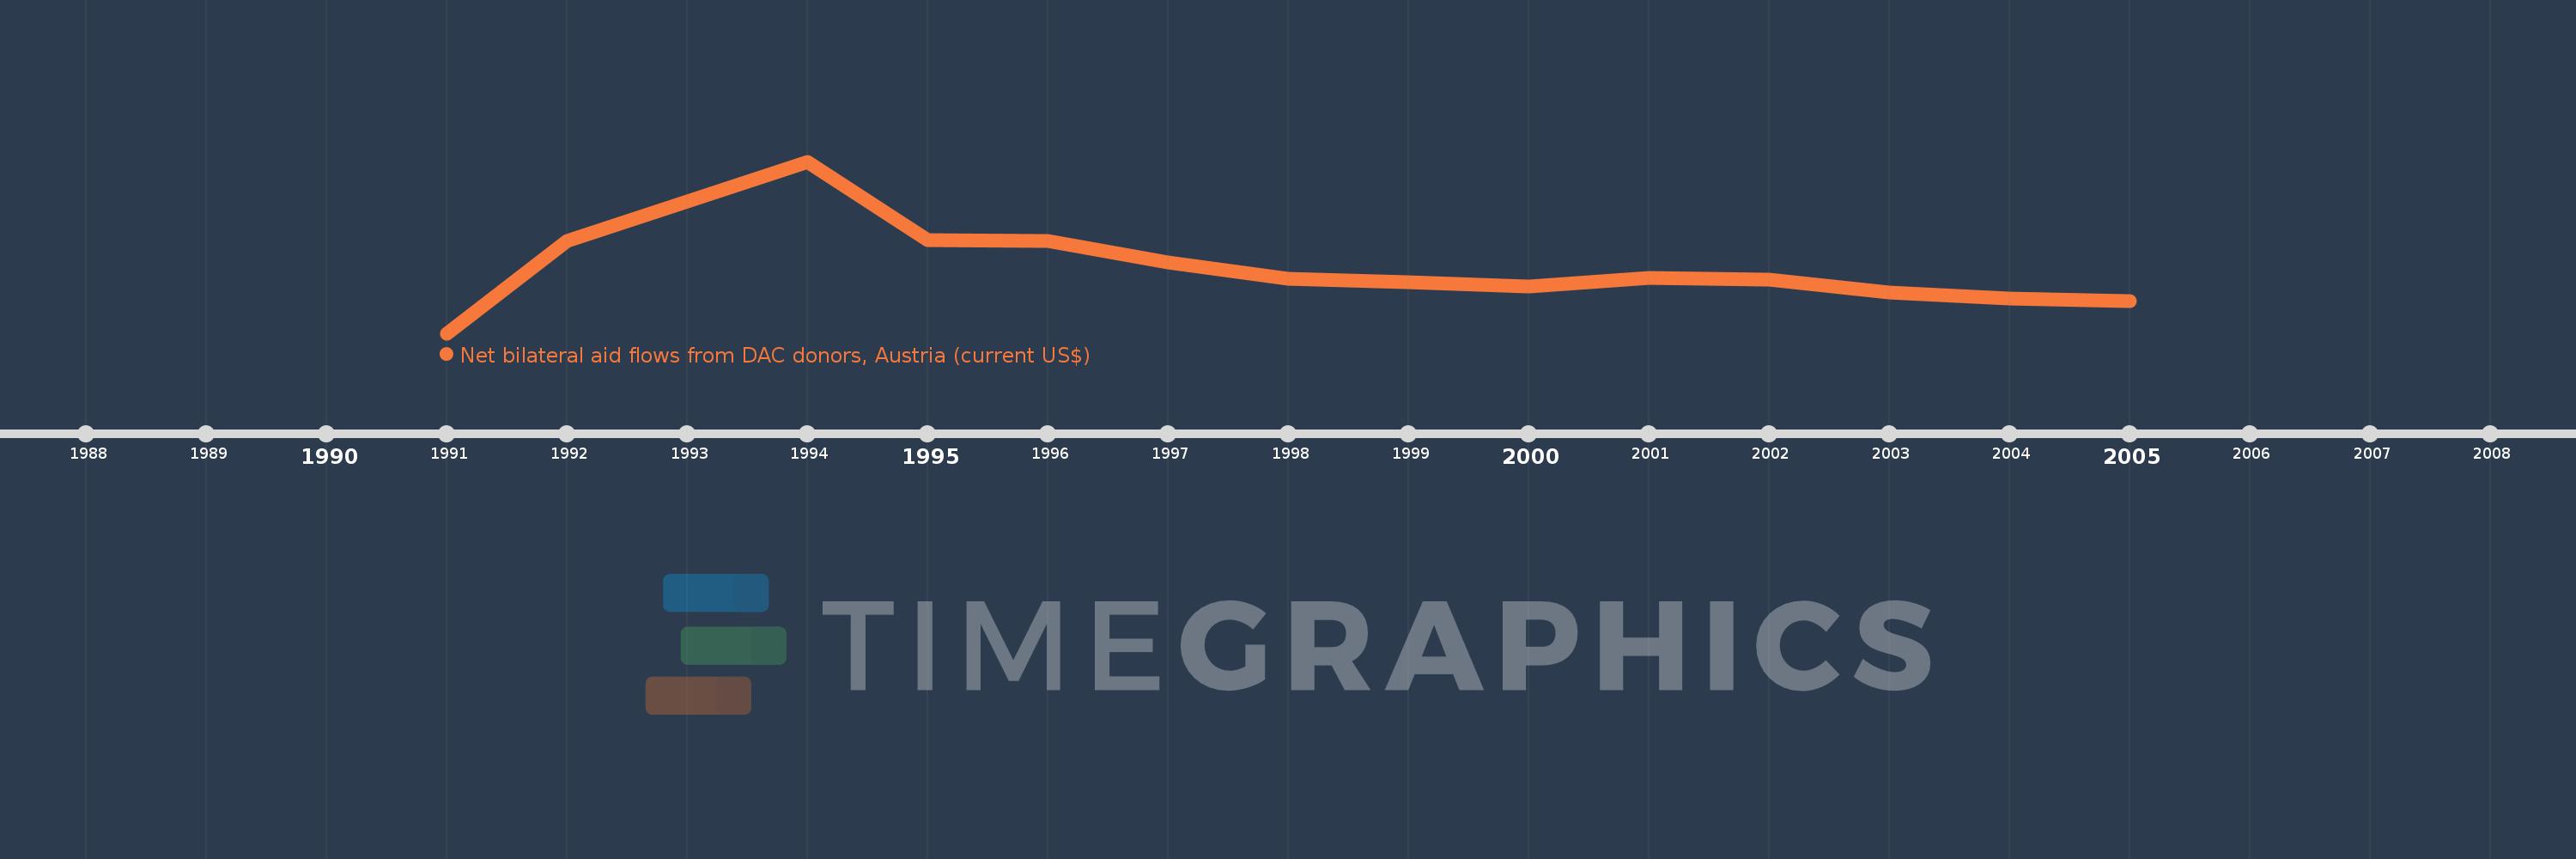
This timeline shows a graph from 1991 to 2005 of Poland. No data until 1990. Number of actual observations by date: 15.
Source name:
World Development Indicators
Source organization:
Development Assistance Committee of the Organisation for Economic Co-operation and Development, Geographical Distribution of Financial Flows to Developing Countries, Development Co-operation Report, and International Development Statistics database. Data are available online at: www.oecd.org/dac/stats/idsonline.
Categories, topics:
Aid Effectiveness
Last updated:
apr 23, 2017
Indicators value changes by year
Meaning:
146.301 mln
Minimum:
26.66 mln
jan 1, 1991
Maximum:
328.93 mln
jan 1, 1994
At the date of observation
Value
Absolute change
Change from the previous value
jan 1, 1991
26.66 mln
+26.66 mln
0.0%
jan 1, 1992
189.22 mln
+162.56 mln
609.75%
jan 1, 1993
257.99 mln
+68.77 mln
36.34%
jan 1, 1994
328.93 mln
+70.94 mln
27.5%
jan 1, 1995
190.12 mln
-138.81 mln
-42.2%
jan 1, 1996
189.8 mln
-320.0K
-0.17%
jan 1, 1997
151.11 mln
-38.69 mln
-20.38%
jan 1, 1998
122.06 mln
-29.05 mln
-19.22%
jan 1, 1999
117.32 mln
-4.74 mln
-3.88%
jan 1, 2000
108.73 mln
-8.59 mln
-7.32%
jan 1, 2001
123.58 mln
+14.85 mln
13.66%
jan 1, 2002
120.57 mln
-3.01 mln
-2.44%
jan 1, 2003
97.7 mln
-22.87 mln
-18.97%
jan 1, 2004
87.86 mln
-9.84 mln
-10.07%
jan 1, 2005
82.87 mln
-4.99 mln
-5.68%
Ranking of countries by current statistics by years