Download This statistics in other country:
Timeline:
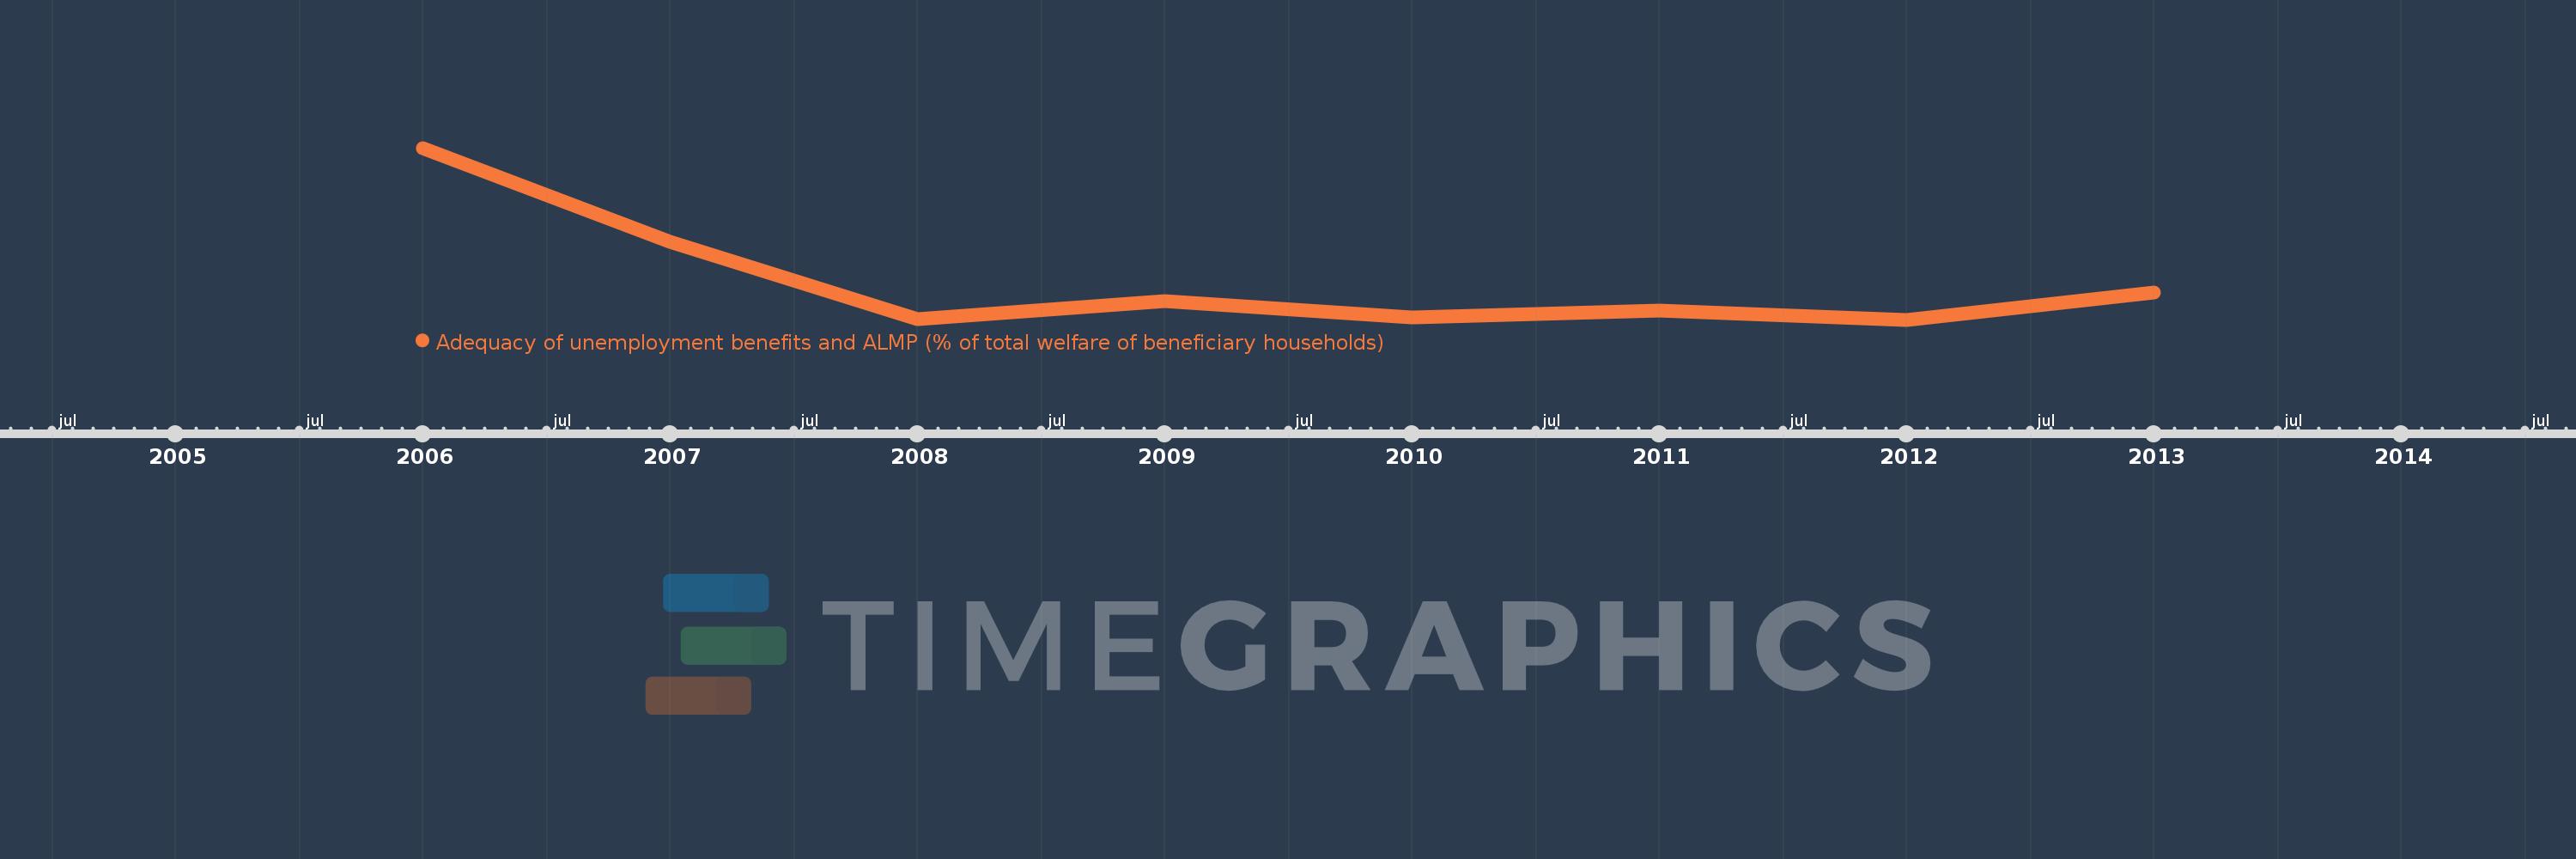
This timeline shows a graph from 2006 to 2013 of Poland. No data until 2005. Number of actual observations by date: 8.
Source name:
World Development Indicators
Source organization:
The Atlas of Social Protection: Indicators of Resilience and Equity (ASPIRE)
Categories, topics:
Social Protection & Labor
Last updated:
apr 23, 2017
Indicators value changes by year
At the date of observation
Value
Absolute change
Change from the previous value
jan 1, 2006
26.25
+26.25
0.0%
jan 1, 2007
23.932
-2.318
-8.83%
jan 1, 2008
22.035
-1.897
-7.93%
jan 1, 2009
22.48
+0.445
2.02%
jan 1, 2010
22.072
-0.408
-1.82%
jan 1, 2011
22.244
+0.172
0.78%
jan 1, 2012
22.01
-0.234
-1.05%
jan 1, 2013
22.683
+0.673
3.06%
Ranking of countries by current statistics by years