33
/
AIzaSyB4mHJ5NPEv-XzF7P6NDYXjlkCWaeKw5bc
November 30, 2025
224351
Philippines
PHL
true
2
1
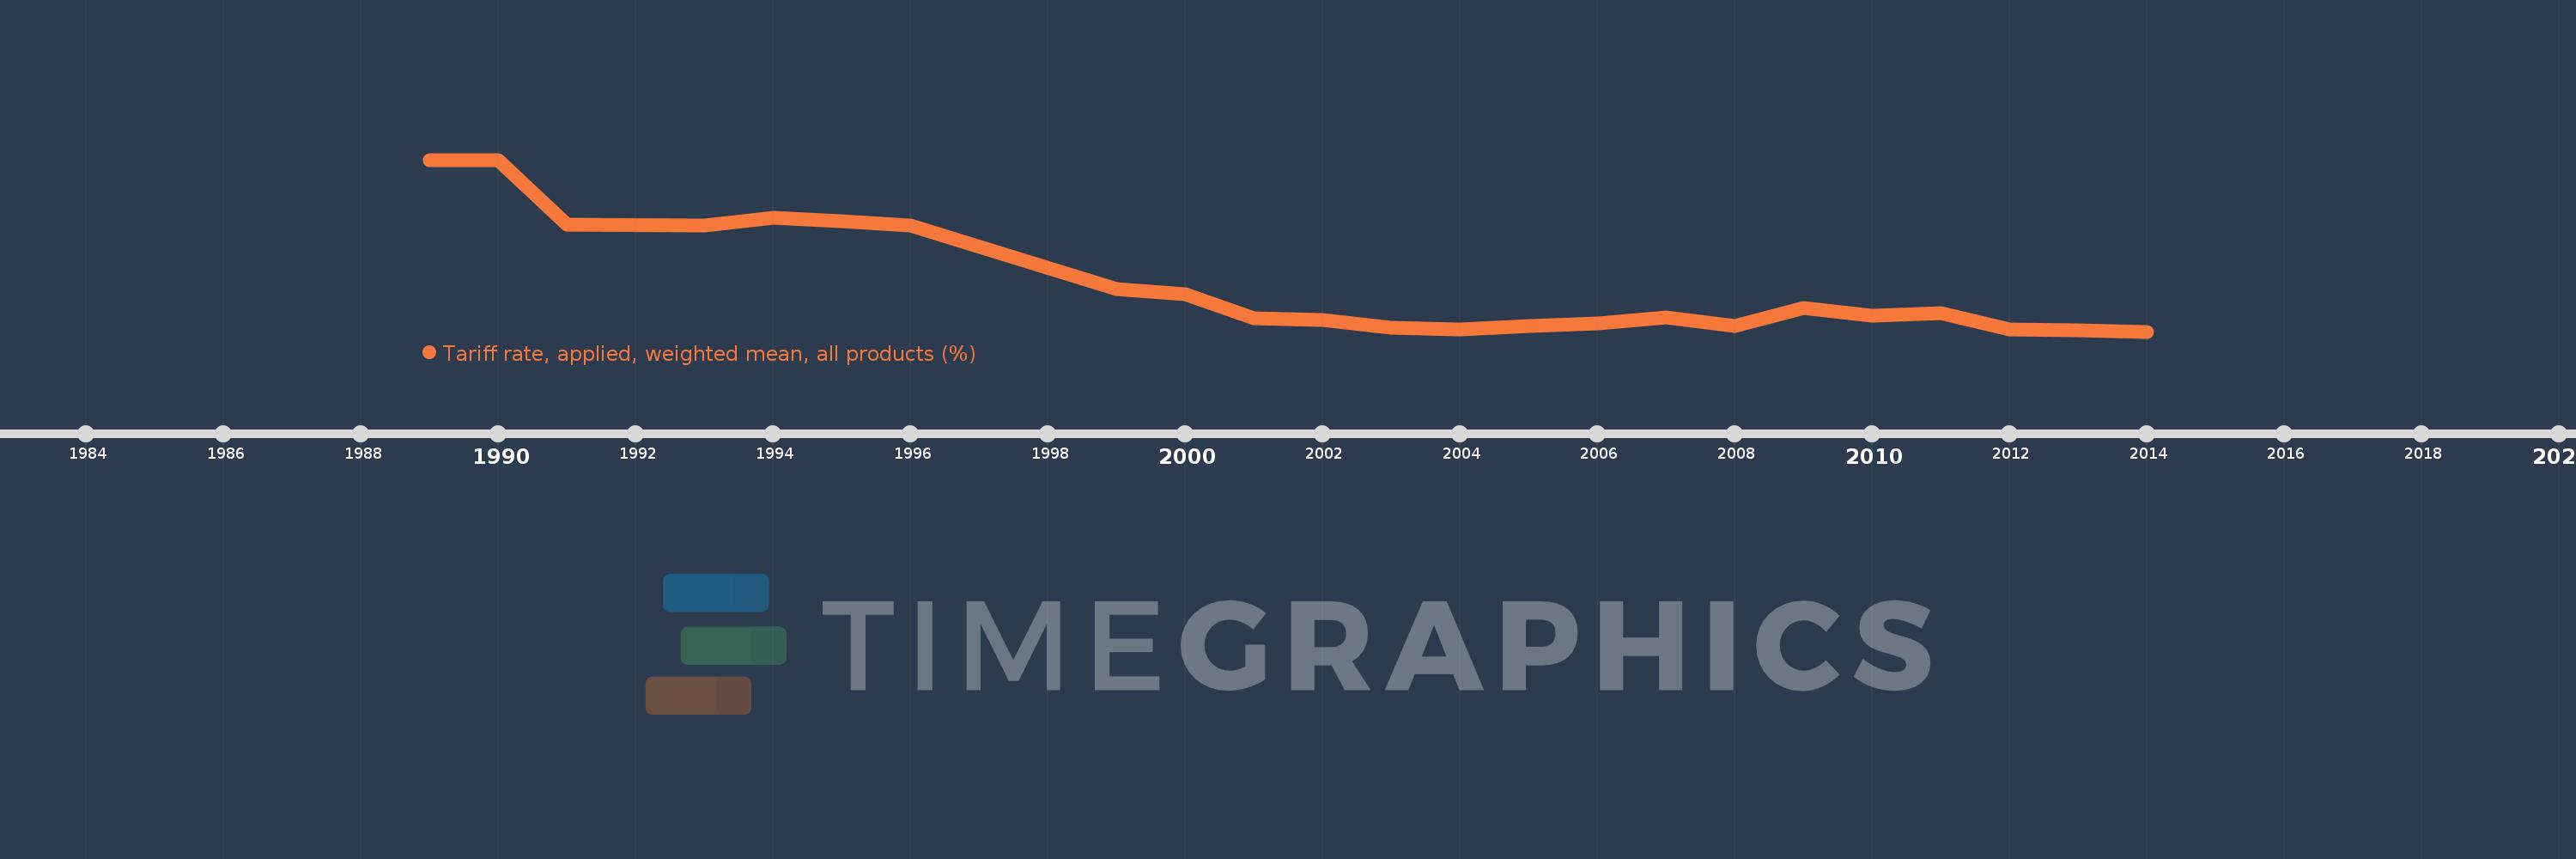
Tariff rate, applied, weighted mean, all products (%)
2014,2013,2012,2011,2010,2009,2008,2007,2006,2005,2004,2003,2002,2001,2000,1999,1996,1995,1994,1993,1991,1990,1989