Download This statistics in other country:
Timeline:
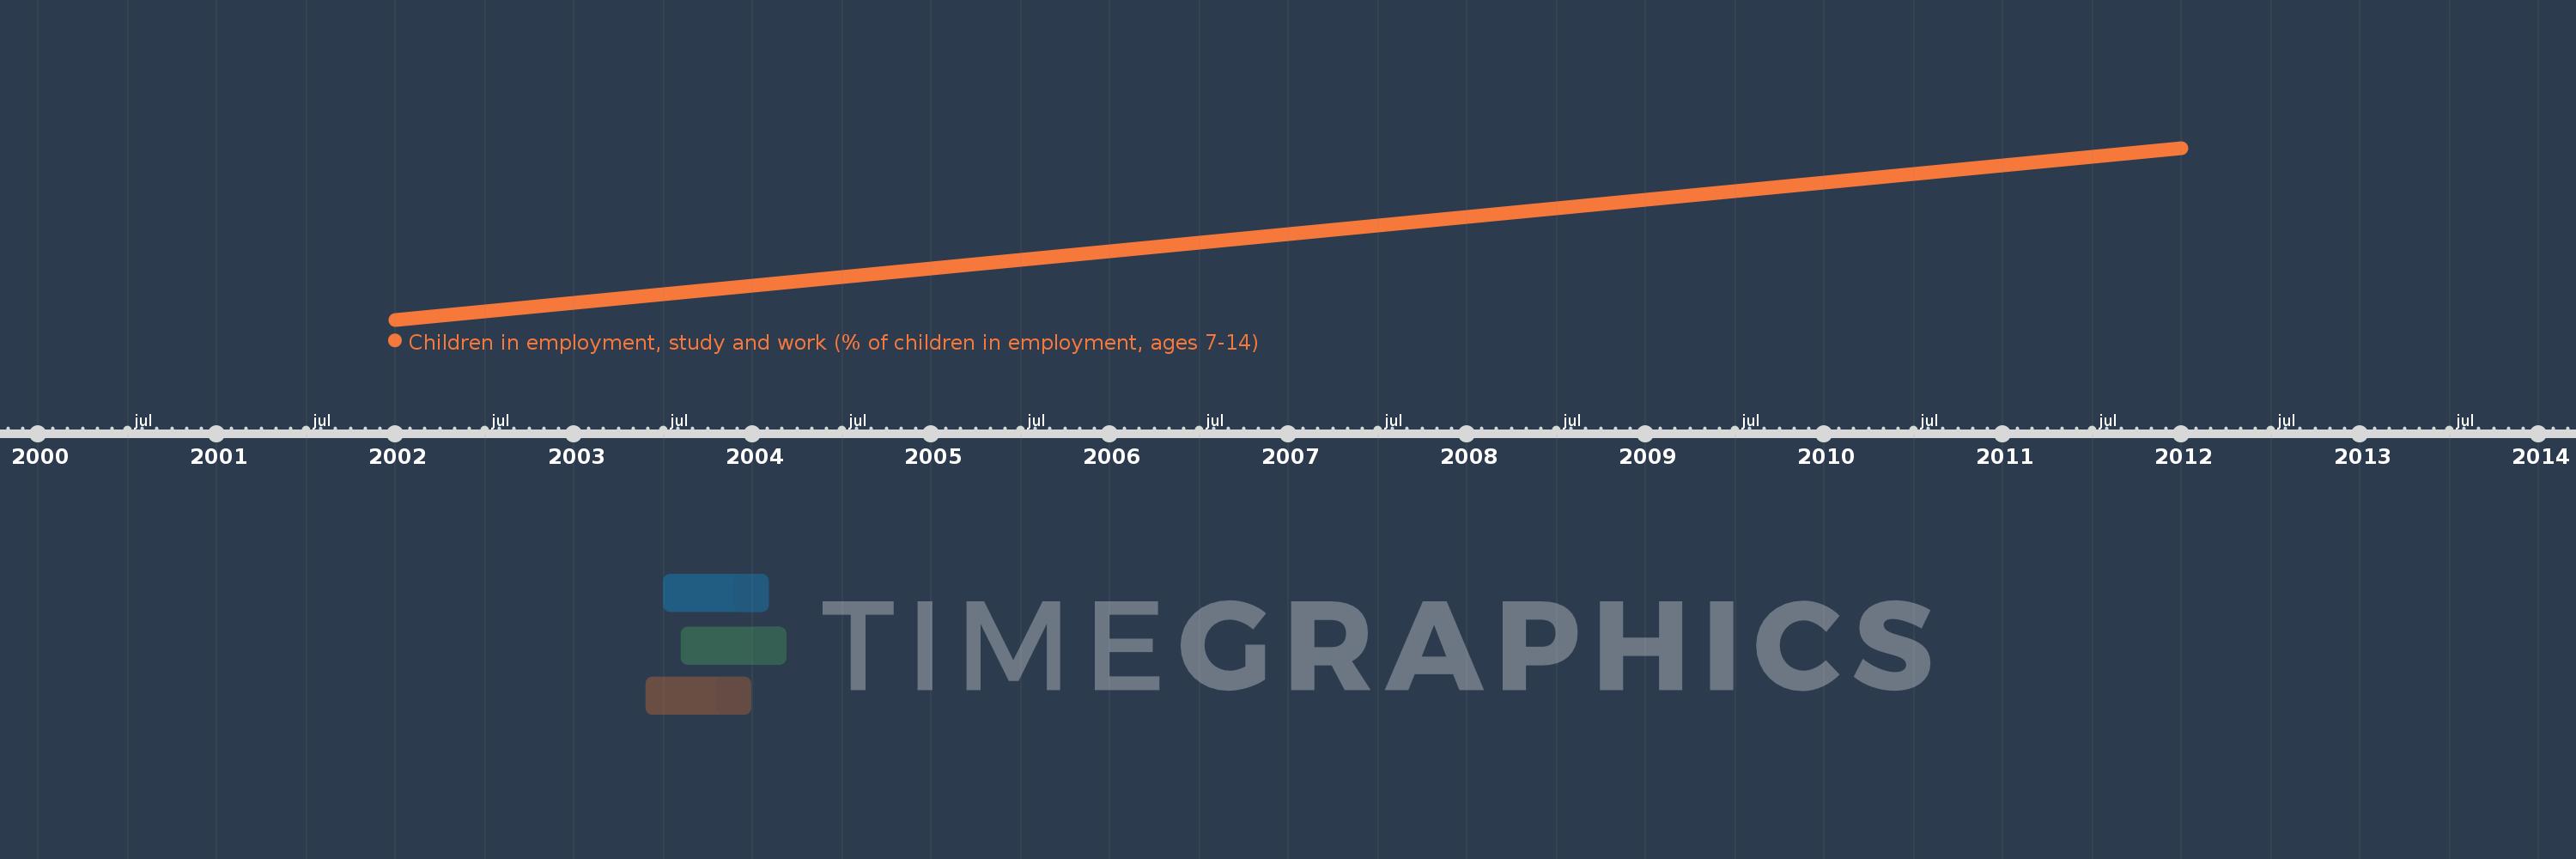
This timeline shows a graph from 2002 to 2012 of Philippines. No data until 2001. Number of actual observations by date: 2.
Source name:
World Development Indicators
Source organization:
Understanding Children's Work project based on data from ILO, UNICEF and the World Bank.
Categories, topics:
Social Protection & Labor, Social Development
Last updated:
apr 23, 2017
Indicators value changes by year
Minimum:
85.201
jan 1, 2002
At the date of observation
Value
Absolute change
Change from the previous value
jan 1, 2002
85.201
+85.201
0.0%
jan 1, 2012
86.1
+0.899
1.06%
Ranking of countries by current statistics by years