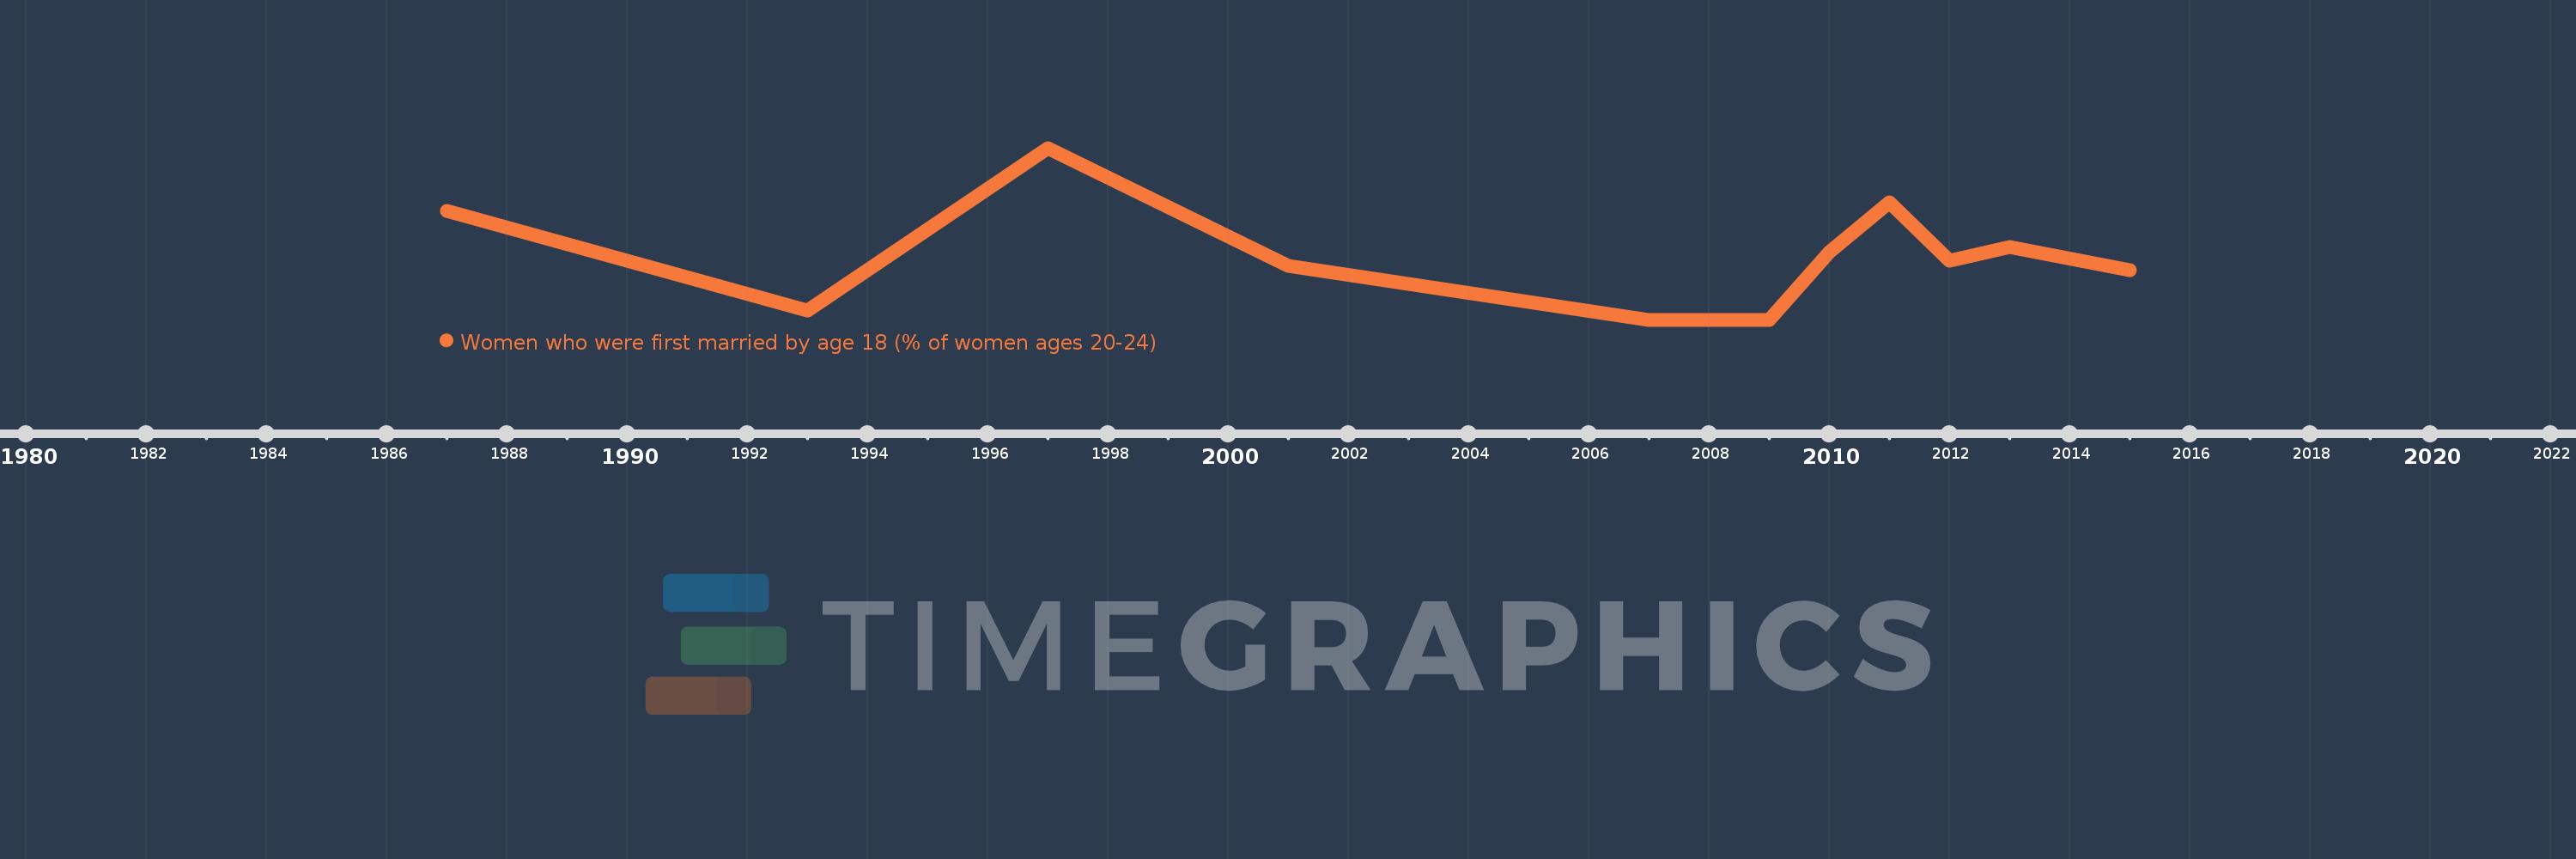
This timeline shows a graph from 1987 to 2015 of Peru. No data until 1986. Number of actual observations by date: 11.
Source name:
World Development Indicators
Source organization:
Demographic and Health Surveys (DHS), Multiple Indicator Cluster Surveys (MICS), AIDS Indicator Surveys(AIS), Reproductive Health Survey(RHS), and other household surveys.
Categories, topics:
Health
Last updated:
apr 23, 2017
Indicators value changes by year
Meaning:
18.927
Minimum:
17.5
jan 1, 2007
Maximum:
21.3
jan 1, 1997
At the date of observation
Value
Absolute change
Change from the previous value
jan 1, 1987
19.9
+19.9
0.0%
jan 1, 1993
17.7
-2.2
-11.06%
jan 1, 1997
21.3
+3.6
20.34%
jan 1, 2001
18.7
-2.6
-12.21%
jan 1, 2007
17.5
-1.2
-6.42%
jan 1, 2009
17.5
0.0
0.0%
jan 1, 2010
19.0
+1.5
8.57%
jan 1, 2011
20.1
+1.1
5.79%
jan 1, 2012
18.8
-1.3
-6.47%
jan 1, 2013
19.1
+0.3
1.6%
jan 1, 2015
18.6
-0.5
-2.62%
Ranking of countries by current statistics by years