33
/
AIzaSyAYiBZKx7MnpbEhh9jyipgxe19OcubqV5w
August 1, 2025
222806
Peru
PER
true
2
1
Prevalence of overweight, weight for height (% of children under 5)
2013,2012,2011,2010,2009,2006,2001,1997,1992
Download
Global statistics library →Peru →

Prevalence of overweight, weight for height (% of children under 5)

This statistics in other country:

AfghanistanAlbaniaAlgeriaAngolaArgentinaArmeniaAustraliaAzerbaijanBahrainBangladeshBarbadosBelarusBelizeBeninBhutanBoliviaBosnia and HerzegovinaBotswanaBrazilBrunei DarussalamBulgariaBurkina FasoBurundiCambodiaCameroonCanadaCentral African RepublicChadChileChinaColombiaComorosCongo, Dem. Rep.Congo, Rep.Costa RicaCote d'IvoireCroatiaCzech RepublicDjiboutiDominican RepublicEast Asia & PacificEast Asia & Pacific (excluding high income)EcuadorEgypt, Arab Rep.El SalvadorEquatorial GuineaEritreaEthiopiaEurope & Central AsiaEurope & Central Asia (excluding high income)FijiFragile and conflict affected situationsGabonGambia, TheGeorgiaGermanyGhanaGreeceGuatemalaGuineaGuinea-BissauGuyanaHaitiHigh incomeHondurasHungaryIDA & IBRD totalIDA totalIndiaIndonesiaIran, Islamic Rep.IraqItalyJamaicaJapanJordanKazakhstanKenyaKiribatiKorea, Dem. People’s Rep.Korea, Rep.KuwaitKyrgyz RepublicLao PDRLatin America & Caribbean Latin America & Caribbean (excluding high income)LebanonLesothoLiberiaLibyaLow & middle incomeLow incomeLower middle incomeMacedonia, FYRMadagascarMalawiMalaysiaMaldivesMaliMauritaniaMauritiusMexicoMiddle East & North AfricaMiddle East & North Africa (excluding high income)Middle incomeMoldovaMongoliaMontenegroMoroccoMozambiqueMyanmarNamibiaNauruNepalNetherlandsNicaraguaNigerNigeriaNorth AmericaOmanPakistanPanamaPapua New GuineaParaguayPeruPhilippinesQatarRomaniaRwandaSamoaSao Tome and PrincipeSaudi ArabiaSenegalSerbiaSeychellesSierra LeoneSingaporeSolomon IslandsSomaliaSouth AfricaSouth AsiaSouth SudanSri LankaSt. LuciaSub-Saharan Africa Sub-Saharan Africa (excluding high income)SudanSurinameSwazilandSyrian Arab RepublicTajikistanTanzaniaThailandTimor-LesteTogoTongaTrinidad and TobagoTunisiaTurkeyTurkmenistanTuvaluUgandaUkraineUnited KingdomUnited StatesUpper middle incomeUruguayUzbekistanVanuatuVenezuela, RBVietnamWest Bank and GazaWorldYemen, Rep.ZambiaZimbabwe

Timeline:

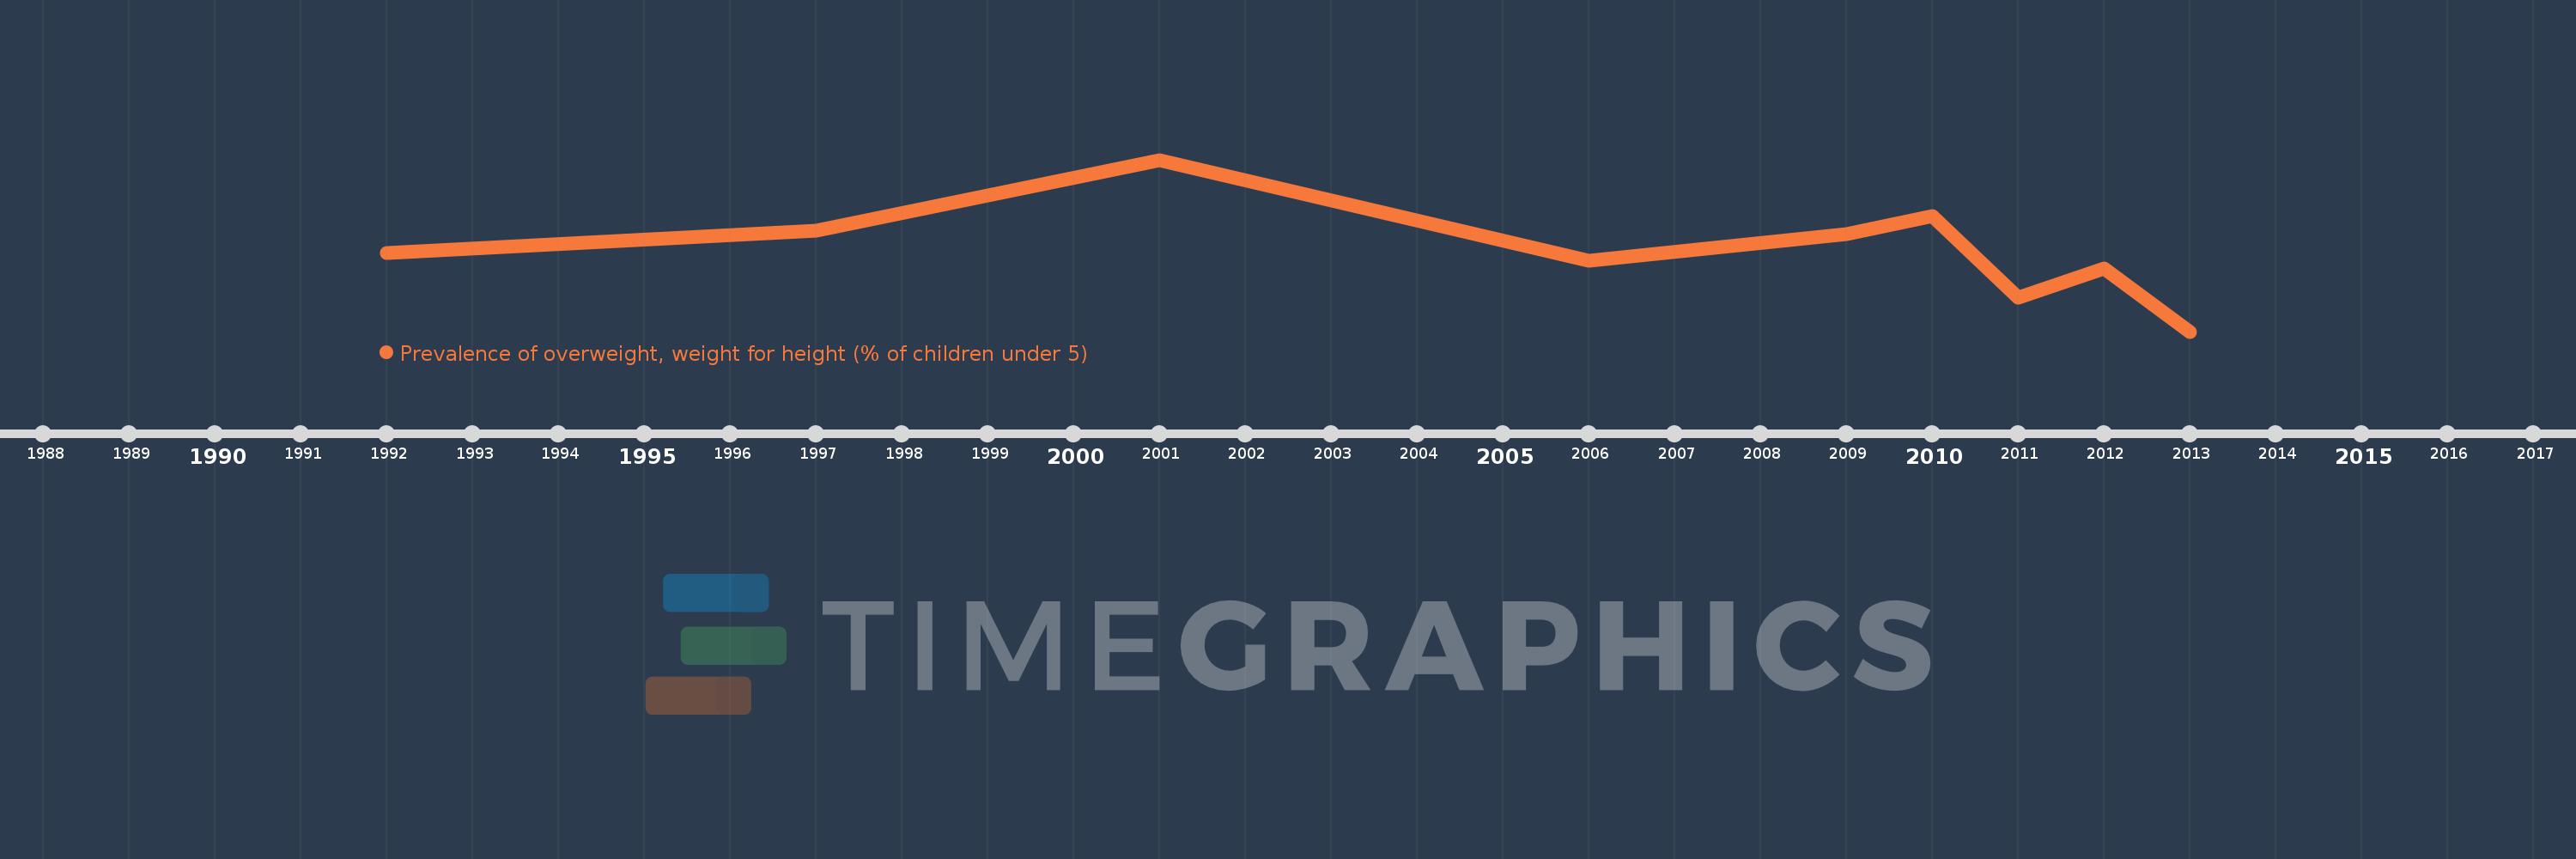
This timeline shows a graph from 1992 to 2013 of Peru. No data until 1991. Number of actual observations by date: 9.

Source name:

World Development Indicators

Source organization:

World Health Organization, Global Database on Child Growth and Malnutrition. Country-level data are unadjusted data from national surveys, and thus may not be comparable across countries. Adjusted, comparable data are available at http://www.who.int/nutgrowthdb/en. Aggregation is based on UNICEF, WHO, and the World Bank harmonized dataset (adjusted, comparable data) and methodology.

Categories, topics:

Health

Last updated:

apr 23, 2017

Indicators value changes by year

Meaning:
9.378
Minimum:
7.2
jan 1, 2013
Maximum:
11.8
jan 1, 2001
At the date of observation
Value
Absolute change
Change from the previous value
jan 1, 1992
9.3
+9.3
0.0%
jan 1, 1997
9.9
+0.6
6.45%
jan 1, 2001
11.8
+1.9
19.19%
jan 1, 2006
9.1
-2.7
-22.88%
jan 1, 2009
9.8
+0.7
7.69%
jan 1, 2010
10.3
+0.5
5.1%
jan 1, 2011
8.1
-2.2
-21.36%
jan 1, 2012
8.9
+0.8
9.88%
jan 1, 2013
7.2
-1.7
-19.1%

Ranking of countries by current statistics by years