Download This statistics in other country:
Timeline:
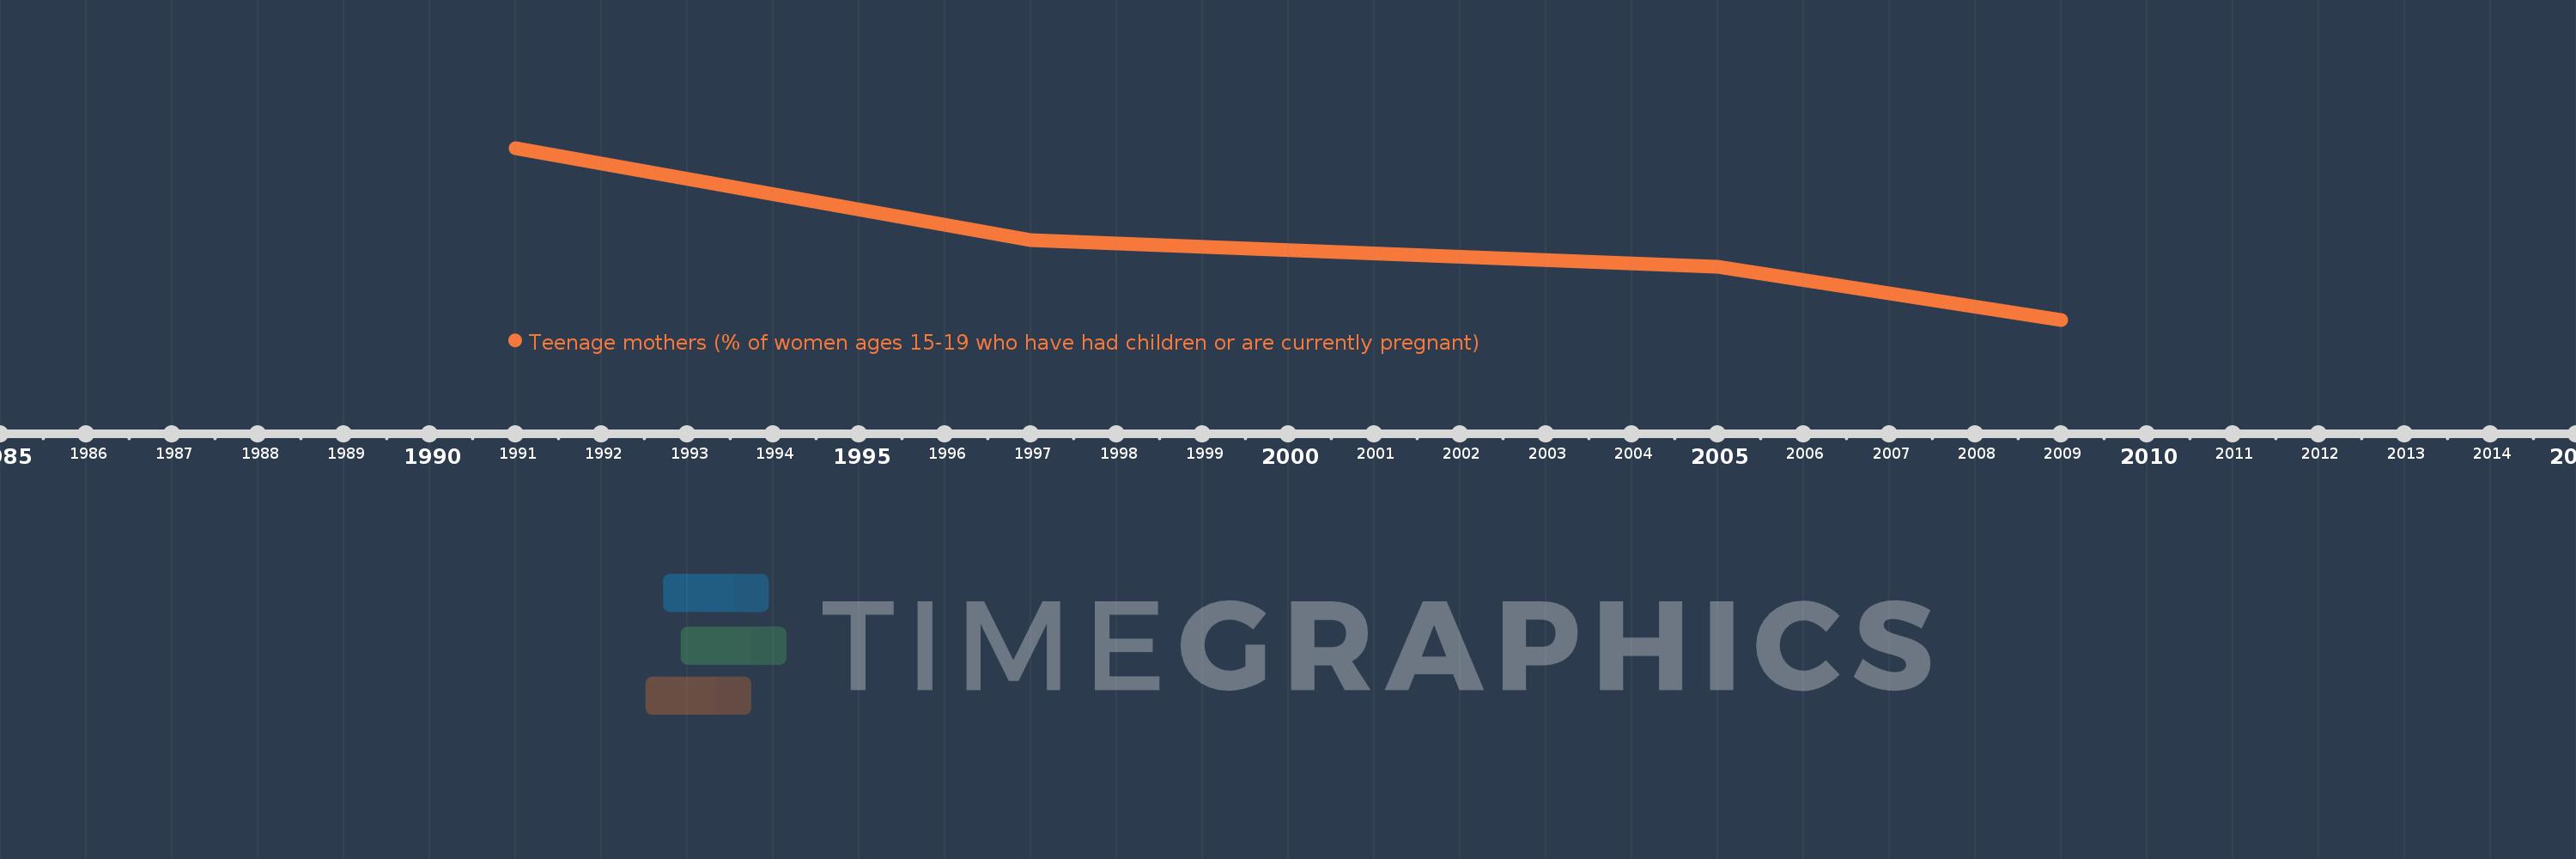
This timeline shows a graph from 1991 to 2009 of Paraguay. No data until 1990. Number of actual observations by date: 4.
Source name:
World Development Indicators
Source organization:
Demographic and Health Surveys.
Categories, topics:
Health, Gender
Last updated:
apr 23, 2017
Indicators value changes by year
At the date of observation
Value
Absolute change
Change from the previous value
jan 1, 1991
16.8
+16.8
0.0%
jan 1, 1997
14.0
-2.8
-16.67%
jan 1, 2005
13.2
-0.8
-5.71%
jan 1, 2009
11.6
-1.6
-12.12%
Ranking of countries by current statistics by years