33
/
AIzaSyB4mHJ5NPEv-XzF7P6NDYXjlkCWaeKw5bc
November 30, 2025
219501
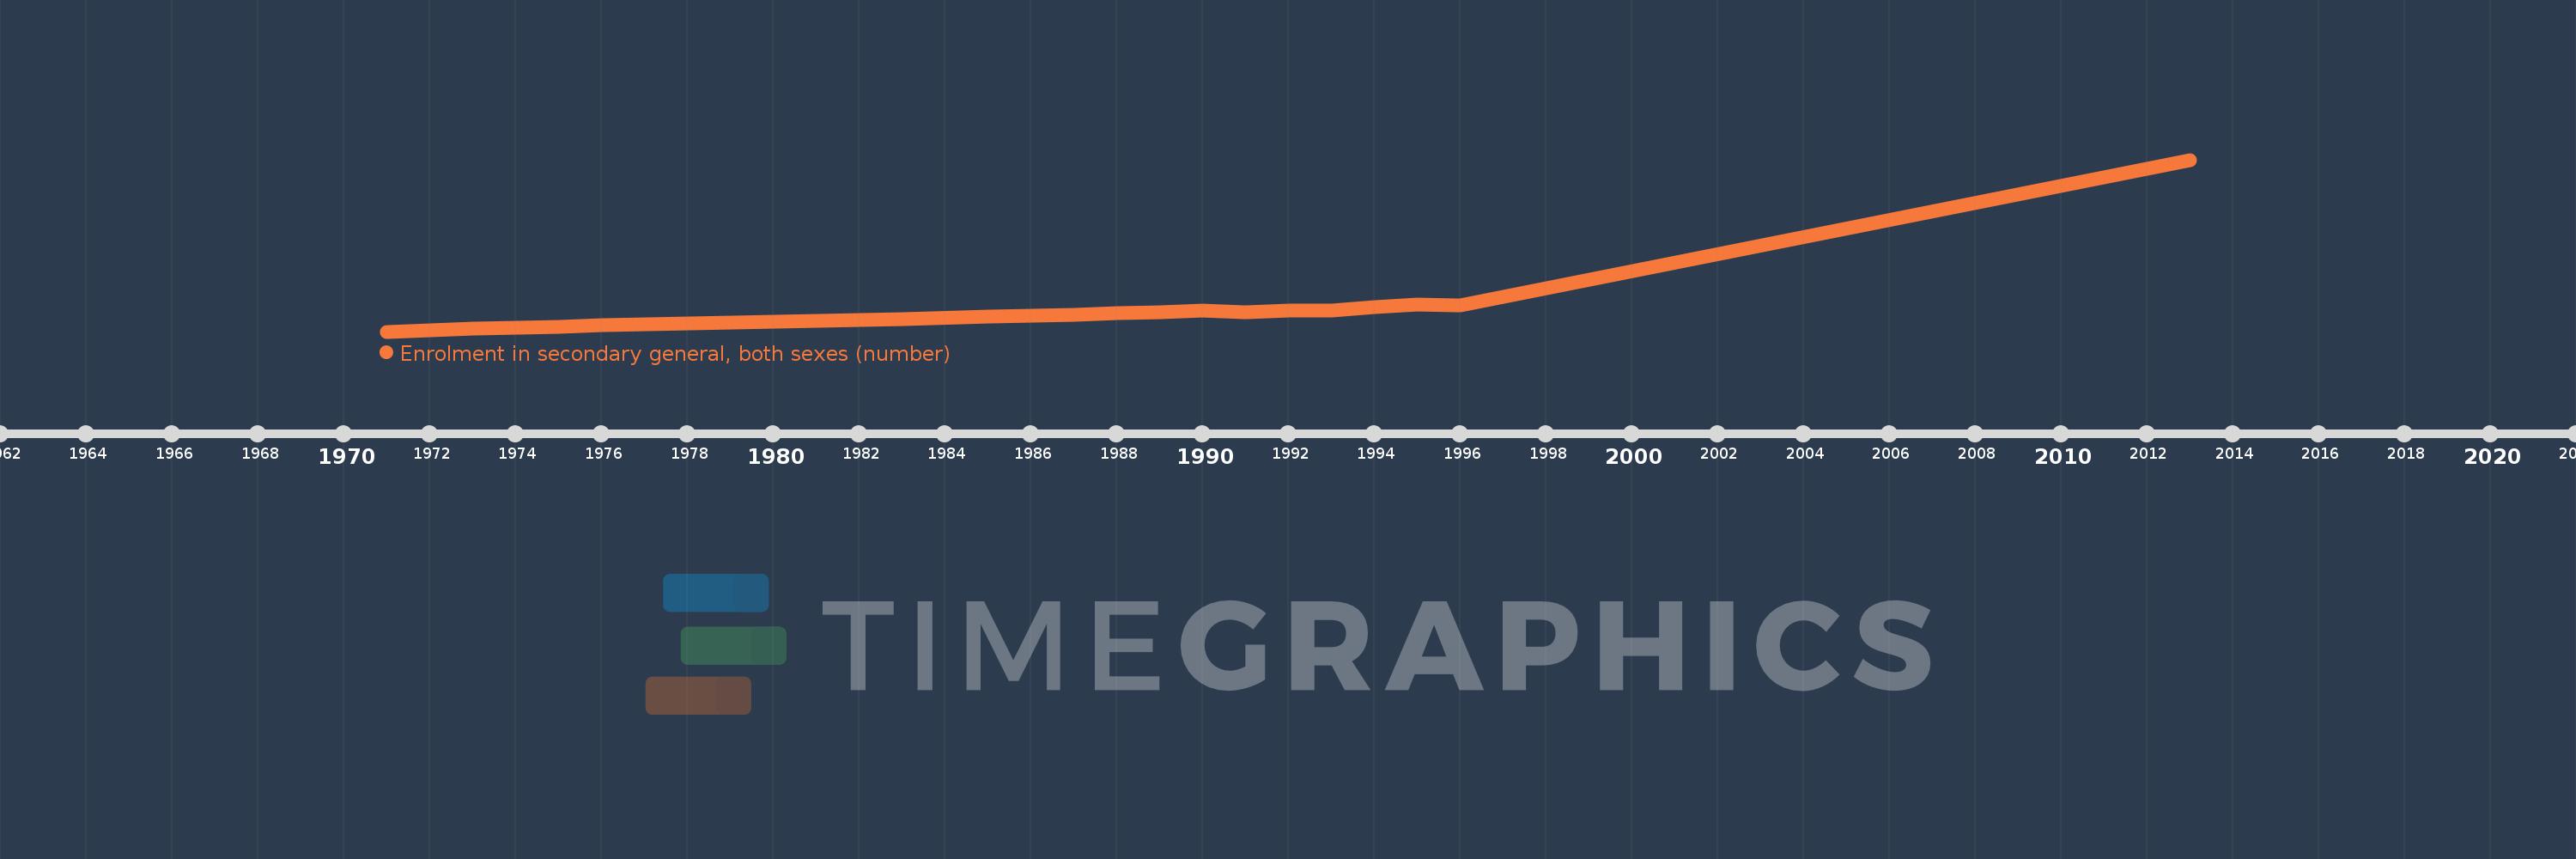
Papua New Guinea
PNG
true
2
1
Enrolment in secondary general, both sexes (number)
2013,1996,1995,1994,1993,1992,1991,1990,1989,1988,1987,1985,1983,1982,1981,1980,1979,1978,1977,1976,1975,1974,1973,1972,1971