29
/
en
AIzaSyAYiBZKx7MnpbEhh9jyipgxe19OcubqV5w
April 1, 2024
219194
Panama
PAN
true
2
1
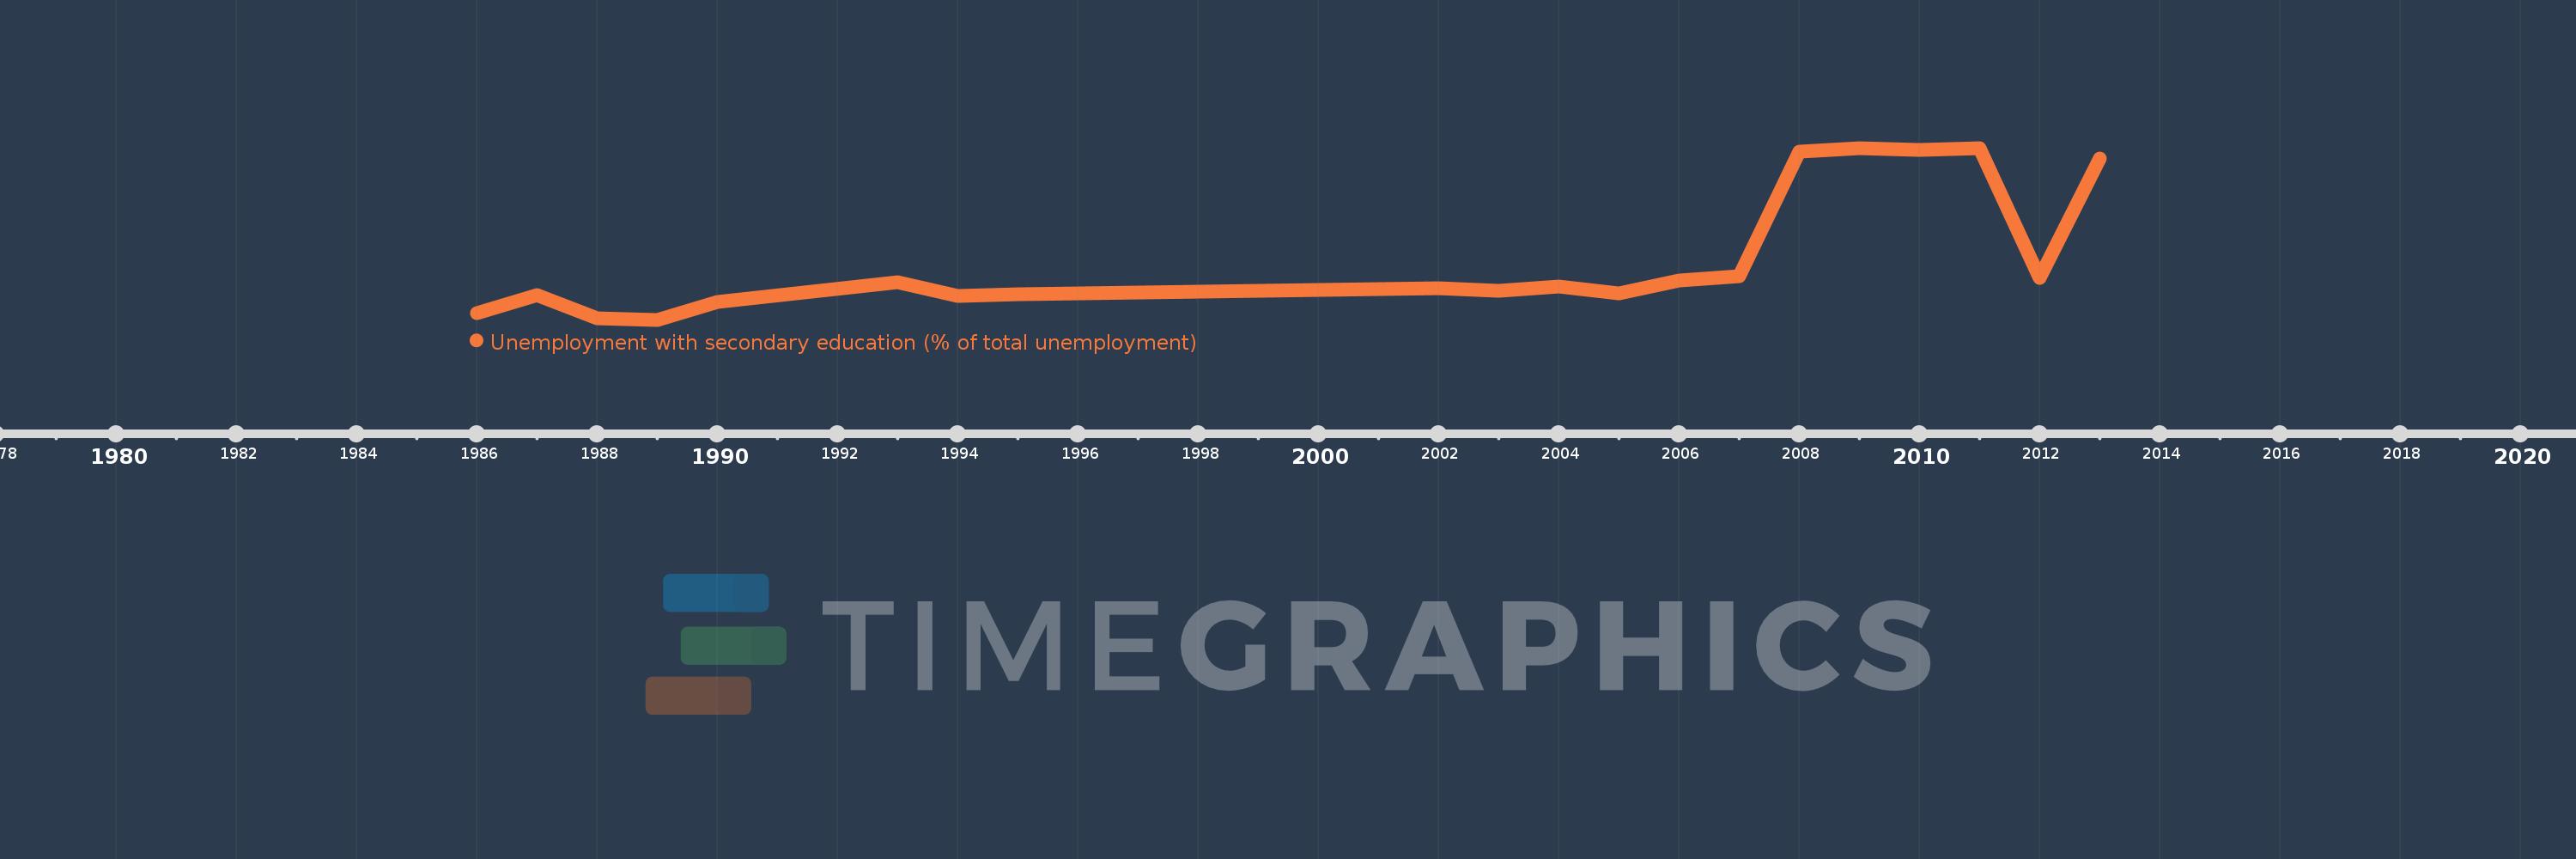
Unemployment with secondary education (% of total unemployment)
2013,2012,2011,2010,2009,2008,2007,2006,2005,2004,2003,2002,1995,1994,1993,1990,1989,1988,1987,1986
This statistics in other country:
Timeline:
This timeline shows a graph from 1986 to 2013 of Panama. No data until 1985. Number of actual observations by date: 20.
Source name:
World Development Indicators
Source organization:
International Labour Organization, Key Indicators of the Labour Market database.
Categories, topics:
Social Protection & Labor
Last updated:
apr 23, 2017
Indicators value changes by year
At the date of observation
Value
Absolute change
Change from previous value
jan 1, 1986
32.4
+32.4
0.0%
jan 1, 1987
35.7
+3.3
10.19%
jan 1, 1988
31.4
-4.3
-12.04%
jan 1, 1989
31.2
-0.2
-0.64%
jan 1, 1990
34.5
+3.3
10.58%
jan 1, 1993
38.1
+3.6
10.43%
jan 1, 1994
35.5
-2.6
-6.82%
jan 1, 1995
35.8
+0.3
0.85%
jan 1, 2002
37.0
+1.2
3.35%
jan 1, 2003
36.5
-0.5
-1.35%
jan 1, 2004
37.3
+0.8
2.19%
jan 1, 2005
36.1
-1.2
-3.22%
jan 1, 2006
38.4
+2.3
6.37%
jan 1, 2007
39.2
+0.8
2.08%
jan 1, 2008
62.1
+22.9
58.42%
jan 1, 2009
62.6
+0.5
0.81%
jan 1, 2010
62.4
-0.2
-0.32%
jan 1, 2011
62.7
+0.3
0.48%
jan 1, 2012
38.8
-23.9
-38.12%
jan 1, 2013
60.8
+22.0
56.7%
Ranking of countries by current statistics by years
Comments: