Download This statistics in other country:
Timeline:
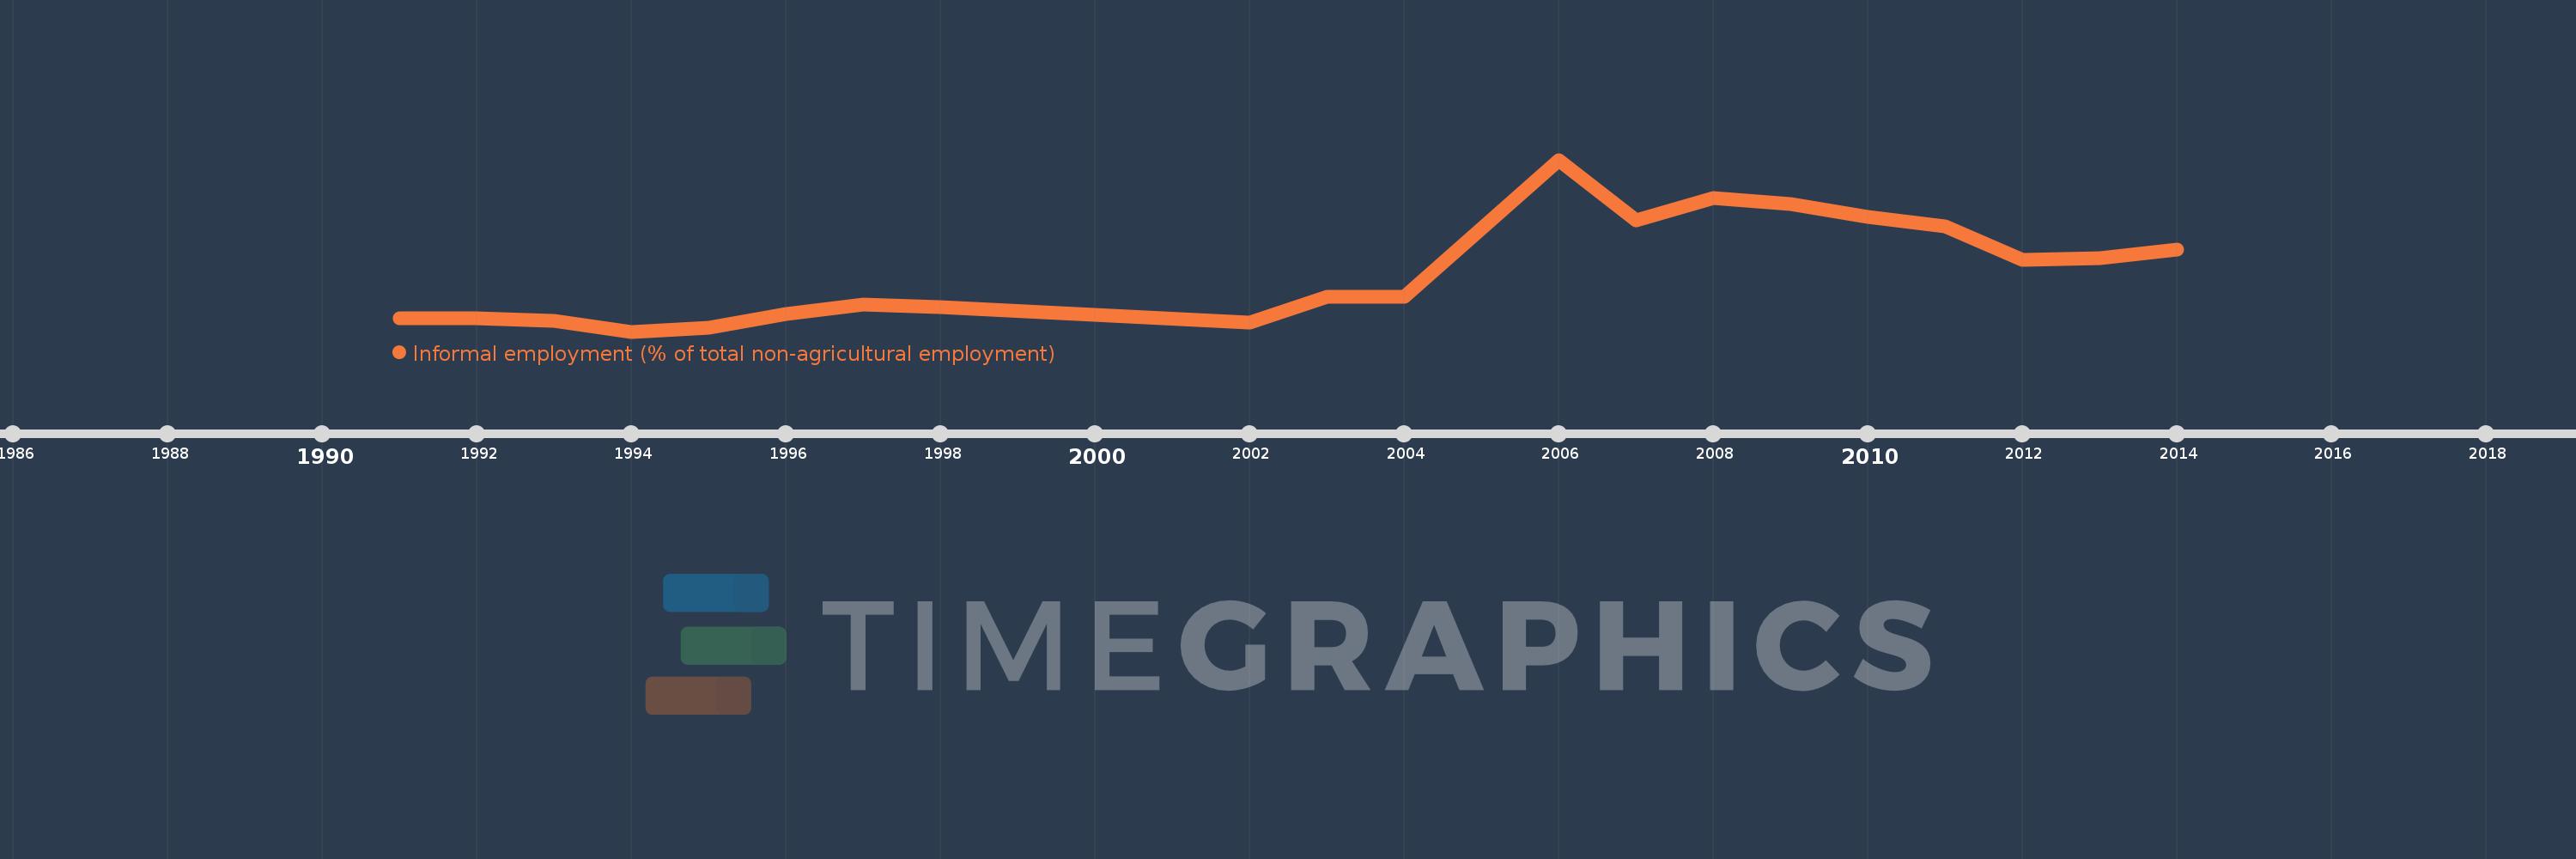
This timeline shows a graph from 1991 to 2014 of Panama. No data until 1990. Number of actual observations by date: 20.
Source name:
World Development Indicators
Source organization:
International Labour Organization, Key Indicators of the Labour Market database.
Categories, topics:
Social Protection & Labor
Last updated:
apr 23, 2017
Indicators value changes by year
At the date of observation
Value
Absolute change
Change from the previous value
jan 1, 1991
33.3
+33.3
0.0%
jan 1, 1993
33.0
-0.3
-0.9%
jan 1, 1994
31.9
-1.1
-3.33%
jan 1, 1995
32.3
+0.4
1.25%
jan 1, 1996
33.7
+1.4
4.33%
jan 1, 1997
34.7
+1.0
2.97%
jan 1, 1998
34.4
-0.3
-0.86%
jan 1, 2002
32.8
-1.6
-4.65%
jan 1, 2003
35.5
+2.7
8.23%
jan 1, 2006
49.7
+14.2
40.0%
jan 1, 2007
43.4
-6.3
-12.68%
jan 1, 2008
45.7
+2.3
5.3%
jan 1, 2009
45.1
-0.6
-1.31%
jan 1, 2010
43.8
-1.3
-2.88%
jan 1, 2011
42.8
-1.0
-2.28%
jan 1, 2012
39.3
-3.5
-8.18%
jan 1, 2013
39.5
+0.2
0.51%
jan 1, 2014
40.4
+0.9
2.28%
Ranking of countries by current statistics by years