33
/
AIzaSyB4mHJ5NPEv-XzF7P6NDYXjlkCWaeKw5bc
November 30, 2025
215357
Oman
OMN
true
2
1
Gross value added at factor cost (current US$)
2016,2015,2014,2013,2012,1981,1980,1979,1978,1977,1976,1975,1974,1973,1972,1971,1970,1969,1968,1967,1966
Create a timeline
Public Timelines
For education
For educational institutions
For teachers
For students
Cabinet
For educational institutions
For teachers
For students
Open cabinet
FAQ
Close
Create a timeline
Public timelines
FAQ
About & Feedback
Terms
Privacy
FAQ
Support 24/7
Cabinet
Get premium
Donate
Download
Global statistics library
→
Oman
→
Gross value added at factor cost (current US$)
This statistics in other country:
Afghanistan
Albania
Algeria
Andorra
Antigua and Barbuda
Argentina
Armenia
Aruba
Australia
Austria
Azerbaijan
Bahamas, The
Bahrain
Bangladesh
Barbados
Belarus
Belgium
Belize
Benin
Bermuda
Bhutan
Bolivia
Bosnia and Herzegovina
Botswana
Brazil
Bulgaria
Burkina Faso
Burundi
Cabo Verde
Cambodia
Cameroon
Canada
Caribbean small states
Cayman Islands
Central African Republic
Central Europe and the Baltics
Chad
Chile
Colombia
Congo, Dem. Rep.
Costa Rica
Croatia
Cuba
Cyprus
Czech Republic
Denmark
Djibouti
Dominica
Dominican Republic
Early-demographic dividend
Ecuador
Egypt, Arab Rep.
El Salvador
Equatorial Guinea
Eritrea
Estonia
Ethiopia
Euro area
Europe & Central Asia
Europe & Central Asia (excluding high income)
Europe & Central Asia (IDA & IBRD countries)
European Union
Faroe Islands
Fiji
Finland
France
Gabon
Gambia, The
Georgia
Germany
Ghana
Greece
Grenada
Guatemala
Guinea
Guinea-Bissau
Guyana
Heavily indebted poor countries (HIPC)
High income
Honduras
Hong Kong SAR, China
Hungary
Iceland
IDA blend
IDA only
IDA total
India
Indonesia
Iran, Islamic Rep.
Ireland
Italy
Jamaica
Japan
Jordan
Kazakhstan
Kenya
Kiribati
Korea, Rep.
Kosovo
Kuwait
Kyrgyz Republic
Lao PDR
Latin America & Caribbean
Latin America & Caribbean (excluding high income)
Latin America & the Caribbean (IDA & IBRD countries)
Latvia
Least developed countries: UN classification
Lebanon
Lesotho
Liberia
Libya
Liechtenstein
Lithuania
Low income
Lower middle income
Luxembourg
Macao SAR, China
Macedonia, FYR
Madagascar
Malawi
Malaysia
Maldives
Mali
Malta
Marshall Islands
Mauritania
Mauritius
Mexico
Micronesia, Fed. Sts.
Middle East & North Africa (excluding high income)
Middle East & North Africa (IDA & IBRD countries)
Moldova
Mongolia
Montenegro
Morocco
Mozambique
Namibia
Nepal
Netherlands
New Zealand
Nicaragua
Nigeria
North America
Norway
OECD members
Oman
Pacific island small states
Pakistan
Palau
Panama
Papua New Guinea
Paraguay
Peru
Poland
Portugal
Post-demographic dividend
Pre-demographic dividend
Romania
Russian Federation
Rwanda
Sao Tome and Principe
Senegal
Serbia
Seychelles
Sierra Leone
Singapore
Slovak Republic
Slovenia
Solomon Islands
South Africa
South Asia
South Asia (IDA & IBRD)
Spain
Sri Lanka
St. Kitts and Nevis
St. Lucia
St. Vincent and the Grenadines
Sub-Saharan Africa
Sub-Saharan Africa (excluding high income)
Sub-Saharan Africa (IDA & IBRD countries)
Sudan
Suriname
Swaziland
Sweden
Switzerland
Syrian Arab Republic
Tajikistan
Tanzania
Thailand
Timor-Leste
Tonga
Trinidad and Tobago
Tunisia
Turkey
Turkmenistan
Tuvalu
Uganda
Ukraine
United Kingdom
United States
Uruguay
Uzbekistan
Vanuatu
Venezuela, RB
Vietnam
West Bank and Gaza
World
Yemen, Rep.
Zambia
Zimbabwe
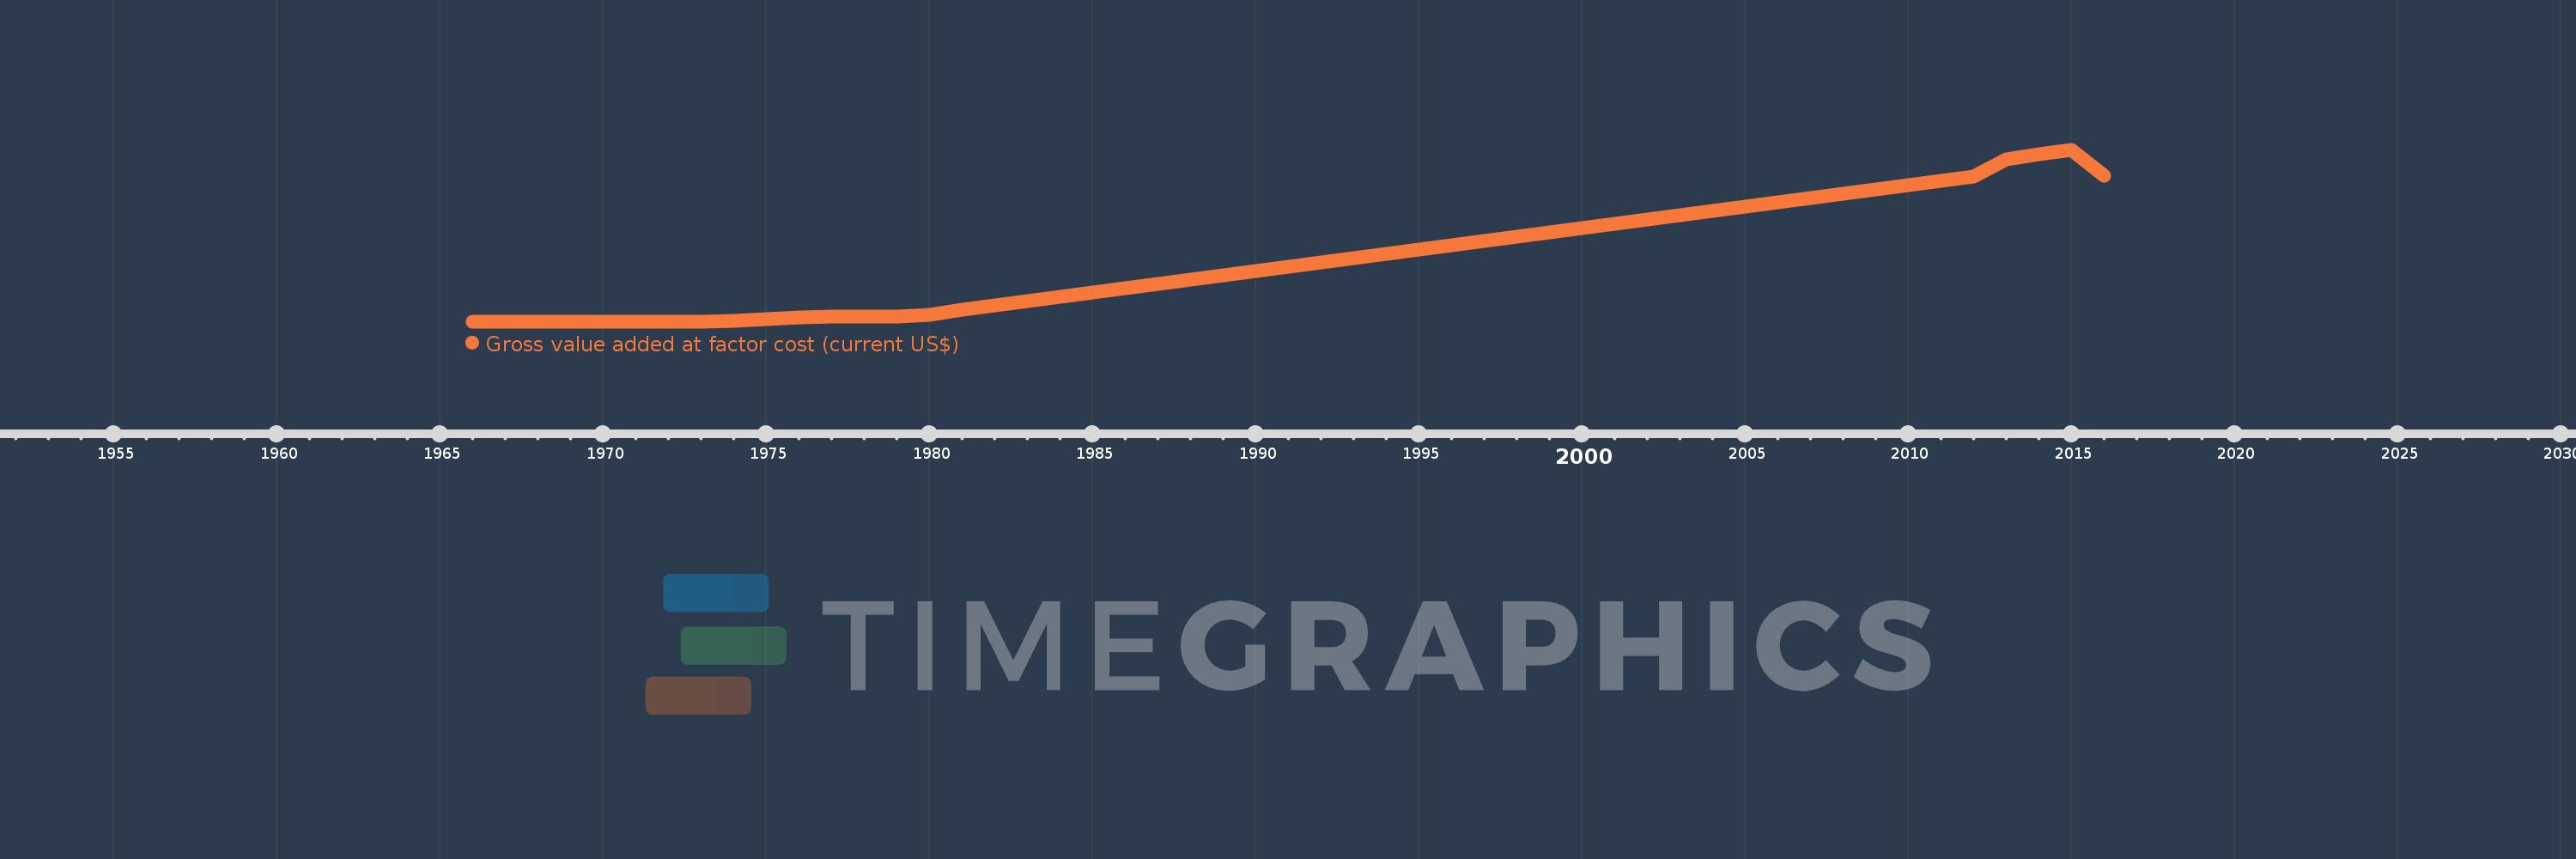
Timeline:
This timeline shows a graph from
1966
to
2016
of Oman. No data until
1965
. Number of actual observations by date:
21
.
Source name:
World Development Indicators
Source organization:
World Bank national accounts data, and OECD National Accounts data files.
Categories, topics:
Economy & Growth
Last updated:
apr 23, 2017
Indicators value changes by year
Meaning:
19.713 bln
Minimum:
61.327 mln
jan 1, 1966
Maximum:
84.481 bln
jan 1, 2015
At the date of observation
Value
Absolute change
Change from the previous value
jan 1, 1966
61.327 mln
+61.327 mln
0.0%
jan 1, 1967
65.808 mln
+4.481 mln
7.31%
jan 1, 1968
104.943 mln
+39.135 mln
59.47%
jan 1, 1969
186.465 mln
+81.522 mln
77.68%
jan 1, 1970
237.101 mln
+50.636 mln
27.16%
jan 1, 1971
253.66 mln
+16.559 mln
6.98%
jan 1, 1972
298.364 mln
+44.704 mln
17.62%
jan 1, 1973
362.689 mln
+64.325 mln
21.56%
jan 1, 1974
478.186 mln
+115.498 mln
31.84%
jan 1, 1975
1.639 bln
+1.161 bln
242.81%
jan 1, 1976
2.095 bln
+455.993 mln
27.82%
jan 1, 1977
2.547 bln
+451.94 mln
21.57%
jan 1, 1978
2.728 bln
+180.66 mln
7.09%
jan 1, 1979
2.728 bln
+289.809K
0.01%
jan 1, 1980
3.71 bln
+981.76 mln
35.99%
jan 1, 1981
5.947 bln
+2.237 bln
60.31%
jan 1, 2012
71.433 bln
+65.486 bln
1.1K%
jan 1, 2013
80.081 bln
+8.648 bln
12.11%
jan 1, 2014
82.619 bln
+2.538 bln
3.17%
jan 1, 2015
84.481 bln
+1.862 bln
2.25%
jan 1, 2016
71.917 bln
-12.564 bln
-14.87%
Ranking of countries by current statistics by years
About & Feedback
Terms
Privacy
FAQ
Support 24/7
Cabinet
Get premium
Donate
The service accepts bank transfer (ACH, Wire) or cards (Visa, MasterCard, etc). Processed by Stripe.
Secured with SSL