33
/
AIzaSyB4mHJ5NPEv-XzF7P6NDYXjlkCWaeKw5bc
November 30, 2025
213708
Nigeria
NGA
true
2
1
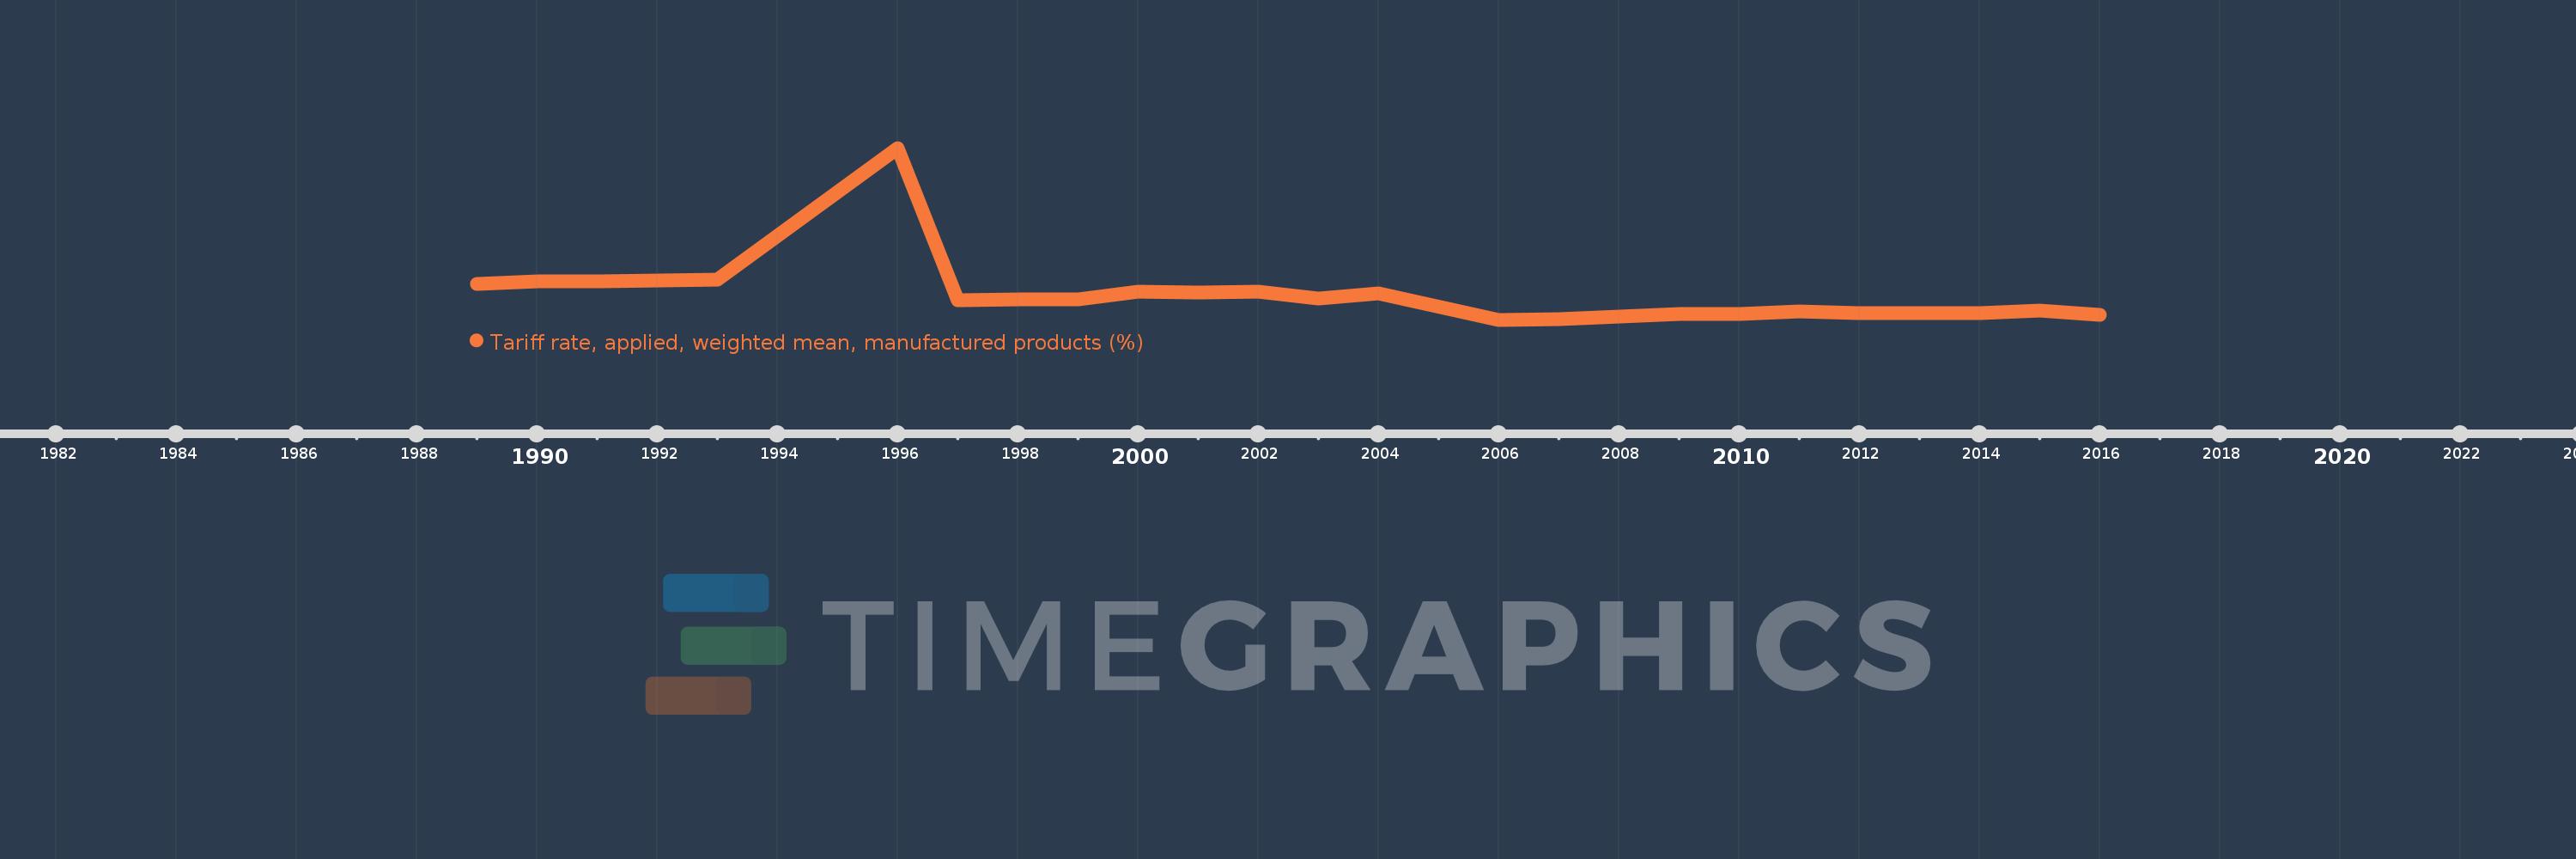
Tariff rate, applied, weighted mean, manufactured products (%)
2016,2015,2014,2012,2011,2010,2009,2007,2006,2004,2003,2002,2001,2000,1999,1998,1997,1996,1993,1991,1990,1989