33
/
AIzaSyB4mHJ5NPEv-XzF7P6NDYXjlkCWaeKw5bc
November 1, 2025
210866
Nicaragua
NIC
true
2
1
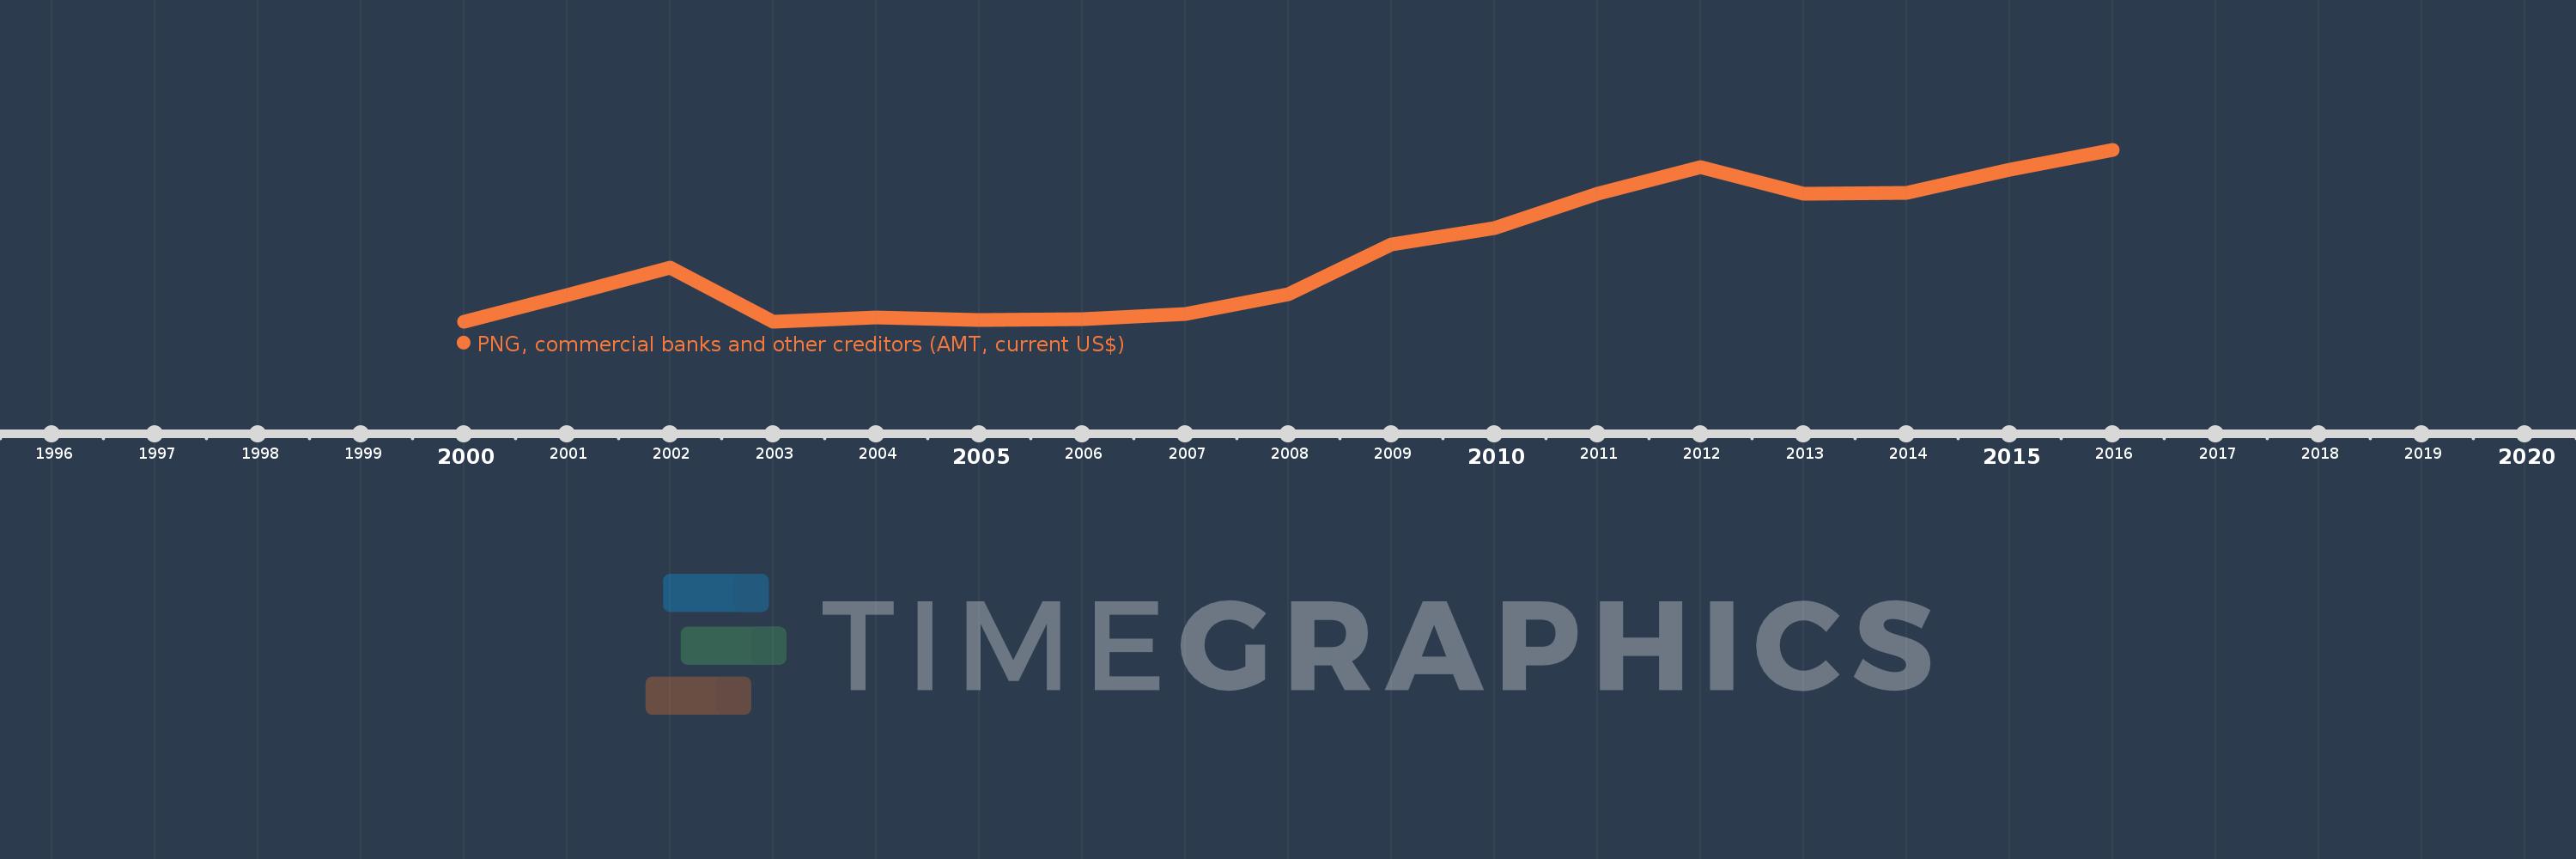
PNG, commercial banks and other creditors (AMT, current US$)
2016,2015,2014,2013,2012,2011,2010,2009,2008,2007,2006,2005,2004,2003,2002,2001,2000
Create a timeline
Public Timelines
For education
For educational institutions
For teachers
For students
Cabinet
For educational institutions
For teachers
For students
Open cabinet
FAQ
Get premium
Close
Create a timeline
Public timelines
FAQ
About & Feedback
Terms
Privacy
FAQ
Support 24/7
Cabinet
Get premium
Donate
Download
Global statistics library
→
Nicaragua
→
PNG, commercial banks and other creditors (AMT, current US$)
This statistics in other country:
Albania
Algeria
Argentina
Armenia
Azerbaijan
Bangladesh
Belarus
Belize
Bhutan
Bolivia
Bosnia and Herzegovina
Brazil
Bulgaria
Cambodia
Cameroon
China
Colombia
Costa Rica
Cote d'Ivoire
Dominican Republic
East Asia & Pacific (excluding high income)
Ecuador
Egypt, Arab Rep.
El Salvador
Europe & Central Asia (excluding high income)
Fiji
Georgia
Ghana
Guatemala
Guyana
Haiti
Honduras
IDA only
India
Indonesia
Jamaica
Jordan
Kazakhstan
Kenya
Kosovo
Kyrgyz Republic
Lao PDR
Latin America & Caribbean (excluding high income)
Liberia
Low & middle income
Low income
Lower middle income
Macedonia, FYR
Madagascar
Malawi
Malaysia
Maldives
Mauritius
Mexico
Middle East & North Africa (excluding high income)
Middle income
Moldova
Mongolia
Montenegro
Morocco
Myanmar
Nicaragua
Niger
Nigeria
Pakistan
Panama
Papua New Guinea
Paraguay
Peru
Philippines
Romania
Russian Federation
Senegal
Serbia
Solomon Islands
South Africa
South Asia
Sri Lanka
Sub-Saharan Africa (excluding high income)
Tajikistan
Tanzania
Thailand
Tunisia
Turkey
Turkmenistan
Ukraine
Upper middle income
Uzbekistan
Venezuela, RB
Vietnam
Zambia
Zimbabwe
Timeline:
This timeline shows a graph from
2000
to
2016
of Nicaragua. No data until
1999
. Number of actual observations by date:
17
.
Source name:
World Development Indicators
Source organization:
World Bank, International Debt Statistics.
Categories, topics:
External Debt
Last updated:
apr 23, 2017
Indicators value changes by year
Meaning:
231.15 mln
Minimum:
37.643 mln
jan 1, 2000
Maximum:
524.332 mln
jan 1, 2016
At the date of observation
Value
Absolute change
Change from the previous value
jan 1, 2000
37.643 mln
+37.643 mln
0.0%
jan 1, 2001
113.583 mln
+75.94 mln
201.74%
jan 1, 2002
190.554 mln
+76.971 mln
67.77%
jan 1, 2003
39.339 mln
-151.215 mln
-79.36%
jan 1, 2004
51.636 mln
+12.297 mln
31.26%
jan 1, 2005
42.932 mln
-8.704 mln
-16.86%
jan 1, 2006
46.83 mln
+3.898 mln
9.08%
jan 1, 2007
59.201 mln
+12.371 mln
26.42%
jan 1, 2008
115.189 mln
+55.988 mln
94.57%
jan 1, 2009
256.873 mln
+141.684 mln
123.0%
jan 1, 2010
303.396 mln
+46.523 mln
18.11%
jan 1, 2011
400.334 mln
+96.938 mln
31.95%
jan 1, 2012
476.638 mln
+76.304 mln
19.06%
jan 1, 2013
399.966 mln
-76.672 mln
-16.09%
jan 1, 2014
402.532 mln
+2.566 mln
0.64%
jan 1, 2015
468.564 mln
+66.032 mln
16.4%
jan 1, 2016
524.332 mln
+55.768 mln
11.9%
Ranking of countries by current statistics by years
About & Feedback
Terms
Privacy
FAQ
Support 24/7
Cabinet
Get premium
Donate
The service accepts bank transfer (ACH, Wire) or cards (Visa, MasterCard, etc). Processed by Stripe.
Secured with SSL