Download This statistics in other country:
AlbaniaAlgeriaArgentinaArmeniaArubaAustraliaAustriaAzerbaijanBahamas, TheBahrainBarbadosBelarusBelgiumBelizeBoliviaBosnia and HerzegovinaBotswanaBrazilBrunei DarussalamBulgariaBurkina FasoCambodiaCanadaCaribbean small statesChadChannel IslandsChileChinaColombiaCosta RicaCroatiaCubaCyprusCzech RepublicDenmarkDominican RepublicEast Asia & PacificEast Asia & Pacific (excluding high income)East Asia & Pacific (IDA & IBRD countries)EcuadorEgypt, Arab Rep.El SalvadorEstoniaEthiopiaEuro areaEurope & Central AsiaEurope & Central Asia (excluding high income)Europe & Central Asia (IDA & IBRD countries)European UnionFijiFinlandFranceFrench PolynesiaGeorgiaGermanyGhanaGreeceGrenadaGuamGuatemalaGuyanaHaitiHigh incomeHondurasHong Kong SAR, ChinaHungaryIBRD onlyIcelandIran, Islamic Rep.IraqIrelandIsraelItalyJamaicaJapanJordanKazakhstanKenyaKorea, Dem. People’s Rep.Korea, Rep.KuwaitKyrgyz RepublicLatin America & Caribbean Latin America & Caribbean (excluding high income)Latin America & the Caribbean (IDA & IBRD countries)LatviaLebanonLibyaLithuaniaLuxembourgMacao SAR, ChinaMacedonia, FYRMalawiMalaysiaMaldivesMaltaMauritiusMexicoMicronesia, Fed. Sts.Middle East & North AfricaMiddle East & North Africa (excluding high income)Middle East & North Africa (IDA & IBRD countries)MoldovaMongoliaMontenegroMoroccoMyanmarNamibiaNetherlandsNew CaledoniaNew ZealandNicaraguaNigerNorth AmericaNorwayOECD membersOmanPakistanPanamaPapua New GuineaParaguayPeruPhilippinesPolandPortugalPuerto RicoQatarRomaniaRussian FederationRwandaSamoaSaudi ArabiaSenegalSerbiaSingaporeSlovak RepublicSloveniaSouth AfricaSpainSri LankaSt. LuciaSt. Vincent and the GrenadinesSurinameSwazilandSwedenSwitzerlandSyrian Arab RepublicTajikistanThailandTongaTrinidad and TobagoTunisiaTurkeyUkraineUnited Arab EmiratesUnited KingdomUnited StatesUpper middle incomeUruguayUzbekistanVenezuela, RBVietnamVirgin Islands (U.S.)West Bank and GazaYemen, Rep.Zambia Timeline:
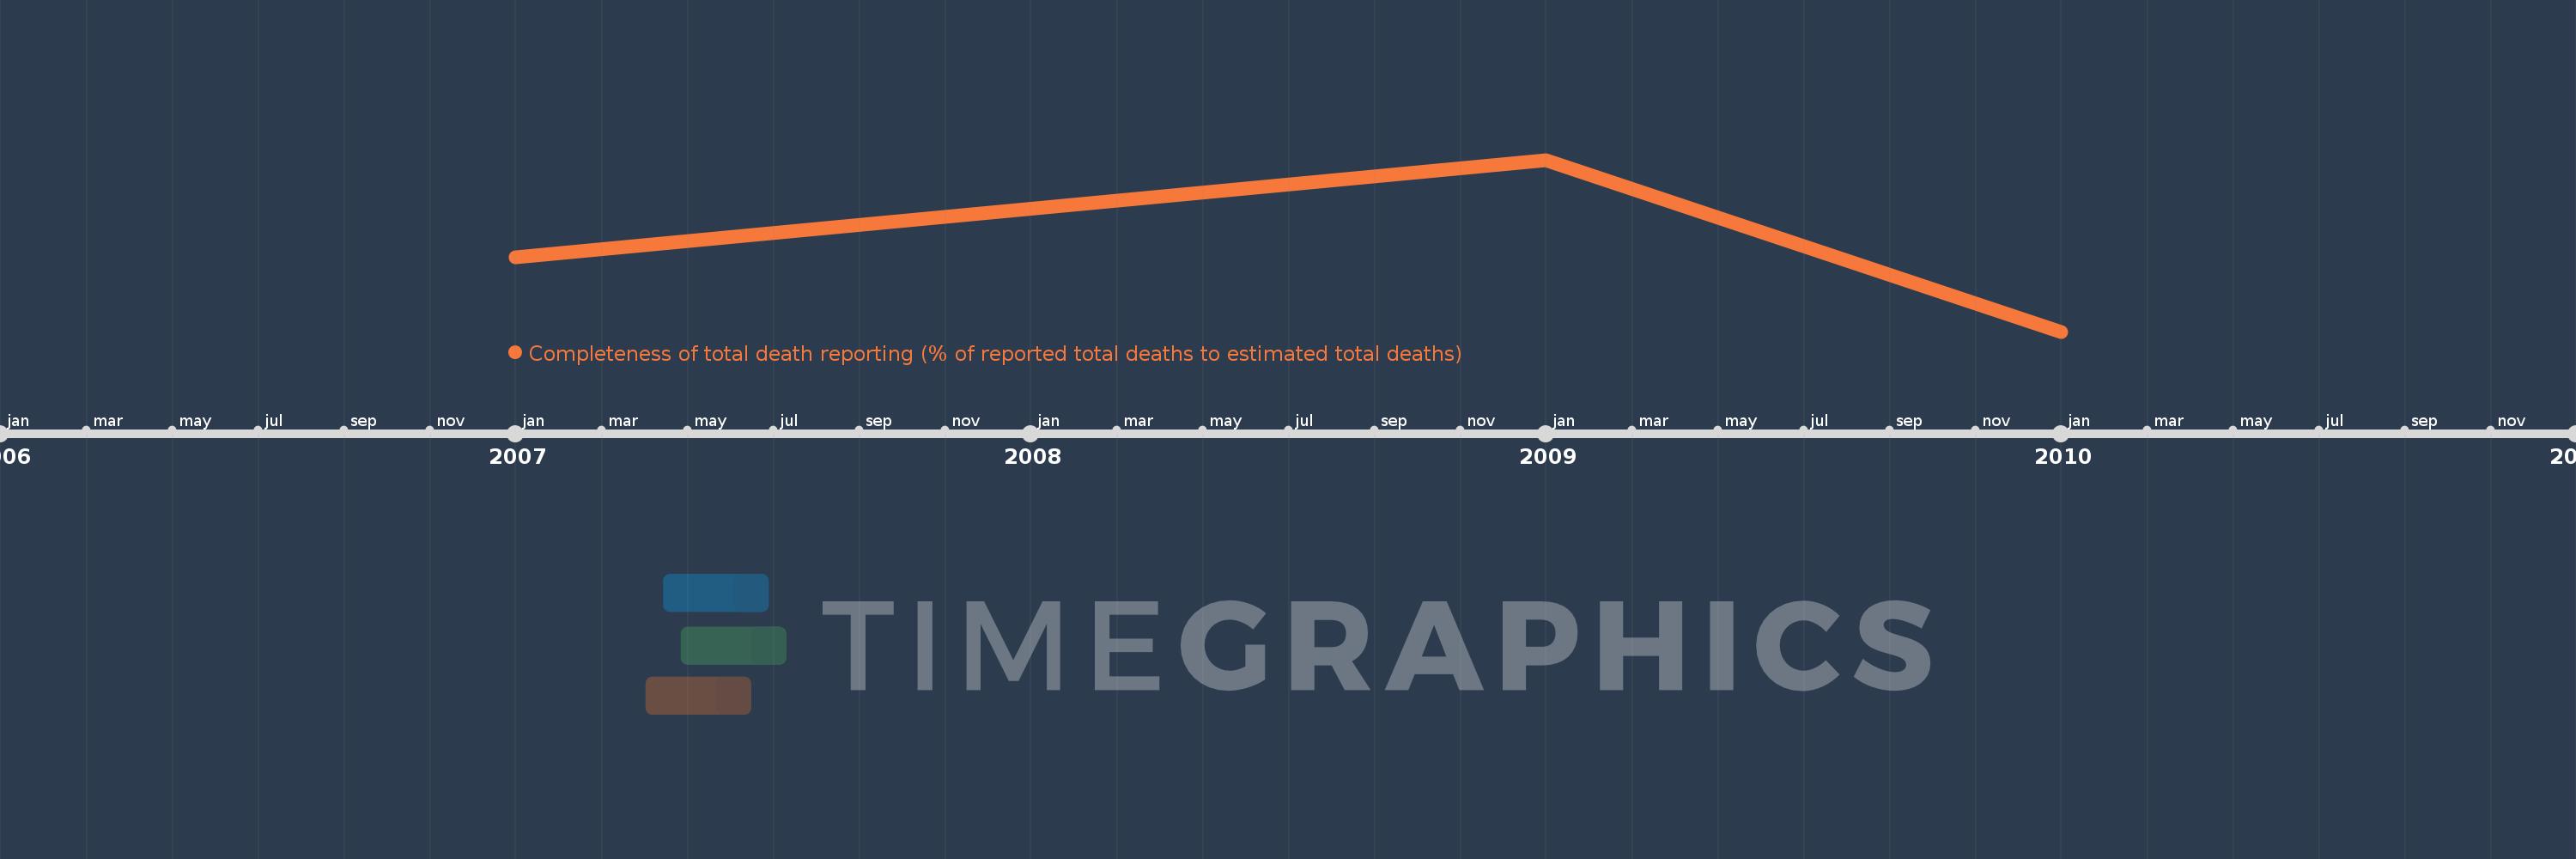
This timeline shows a graph from 2007 to 2010 of New Zealand. No data until 2006. Number of actual observations by date: 3.
Source name:
World Development Indicators
Source organization:
The United Nations Statistics Division's Population and Vital Statistics Report and the United Nations Population Division's World Population Prospects.
Categories, topics:
Health
Last updated:
apr 23, 2017
Indicators value changes by year
Minimum:
95.885
jan 1, 2010
Maximum:
97.877
jan 1, 2009
At the date of observation
Value
Absolute change
Change from the previous value
jan 1, 2007
96.749
+96.749
0.0%
jan 1, 2009
97.877
+1.128
1.17%
jan 1, 2010
95.885
-1.992
-2.04%
Ranking of countries by current statistics by years