33
/
AIzaSyB4mHJ5NPEv-XzF7P6NDYXjlkCWaeKw5bc
November 30, 2025
204361
Myanmar
MMR
true
2
1
Military expenditure (current LCU)
2016,2015,2014,2013,2006,2005,2004,2003,2002,2001,2000,1999,1998,1997,1996,1995,1994,1993,1992,1991,1990,1989
Create a timeline
Public Timelines
For education
For educational institutions
For teachers
For students
Cabinet
For educational institutions
For teachers
For students
Open cabinet
FAQ
Close
Create a timeline
Public timelines
FAQ
About & Feedback
Terms
Privacy
FAQ
Support 24/7
Cabinet
Get premium
Donate
Download
Global statistics library
→
Myanmar
→
Military expenditure (current LCU)
This statistics in other country:
Afghanistan
Albania
Algeria
Angola
Argentina
Armenia
Australia
Austria
Azerbaijan
Bahrain
Bangladesh
Belarus
Belgium
Belize
Benin
Bolivia
Bosnia and Herzegovina
Botswana
Brazil
Brunei Darussalam
Bulgaria
Burkina Faso
Burundi
Cabo Verde
Cambodia
Cameroon
Canada
Central African Republic
Chad
Chile
China
Colombia
Congo, Dem. Rep.
Congo, Rep.
Costa Rica
Cote d'Ivoire
Croatia
Cuba
Cyprus
Czech Republic
Denmark
Djibouti
Dominican Republic
Ecuador
Egypt, Arab Rep.
El Salvador
Equatorial Guinea
Eritrea
Estonia
Ethiopia
Fiji
Finland
France
Gabon
Gambia, The
Georgia
Germany
Ghana
Greece
Guatemala
Guinea
Guinea-Bissau
Guyana
Haiti
Honduras
Hungary
Iceland
India
Indonesia
Iran, Islamic Rep.
Iraq
Ireland
Israel
Italy
Jamaica
Japan
Jordan
Kazakhstan
Kenya
Korea, Dem. People’s Rep.
Korea, Rep.
Kosovo
Kuwait
Kyrgyz Republic
Lao PDR
Latvia
Lebanon
Lesotho
Liberia
Libya
Lithuania
Luxembourg
Macedonia, FYR
Madagascar
Malawi
Malaysia
Mali
Malta
Mauritania
Mauritius
Mexico
Moldova
Mongolia
Montenegro
Morocco
Mozambique
Myanmar
Namibia
Nepal
Netherlands
New Zealand
Nicaragua
Niger
Nigeria
Norway
Oman
Pakistan
Panama
Papua New Guinea
Paraguay
Peru
Philippines
Poland
Portugal
Qatar
Romania
Russian Federation
Rwanda
Saudi Arabia
Senegal
Serbia
Seychelles
Sierra Leone
Singapore
Slovak Republic
Slovenia
Somalia
South Africa
South Sudan
Spain
Sri Lanka
Sudan
Swaziland
Sweden
Switzerland
Syrian Arab Republic
Tajikistan
Tanzania
Thailand
Timor-Leste
Togo
Trinidad and Tobago
Tunisia
Turkey
Turkmenistan
Uganda
Ukraine
United Arab Emirates
United Kingdom
United States
Uruguay
Uzbekistan
Venezuela, RB
Vietnam
Yemen, Rep.
Zambia
Zimbabwe
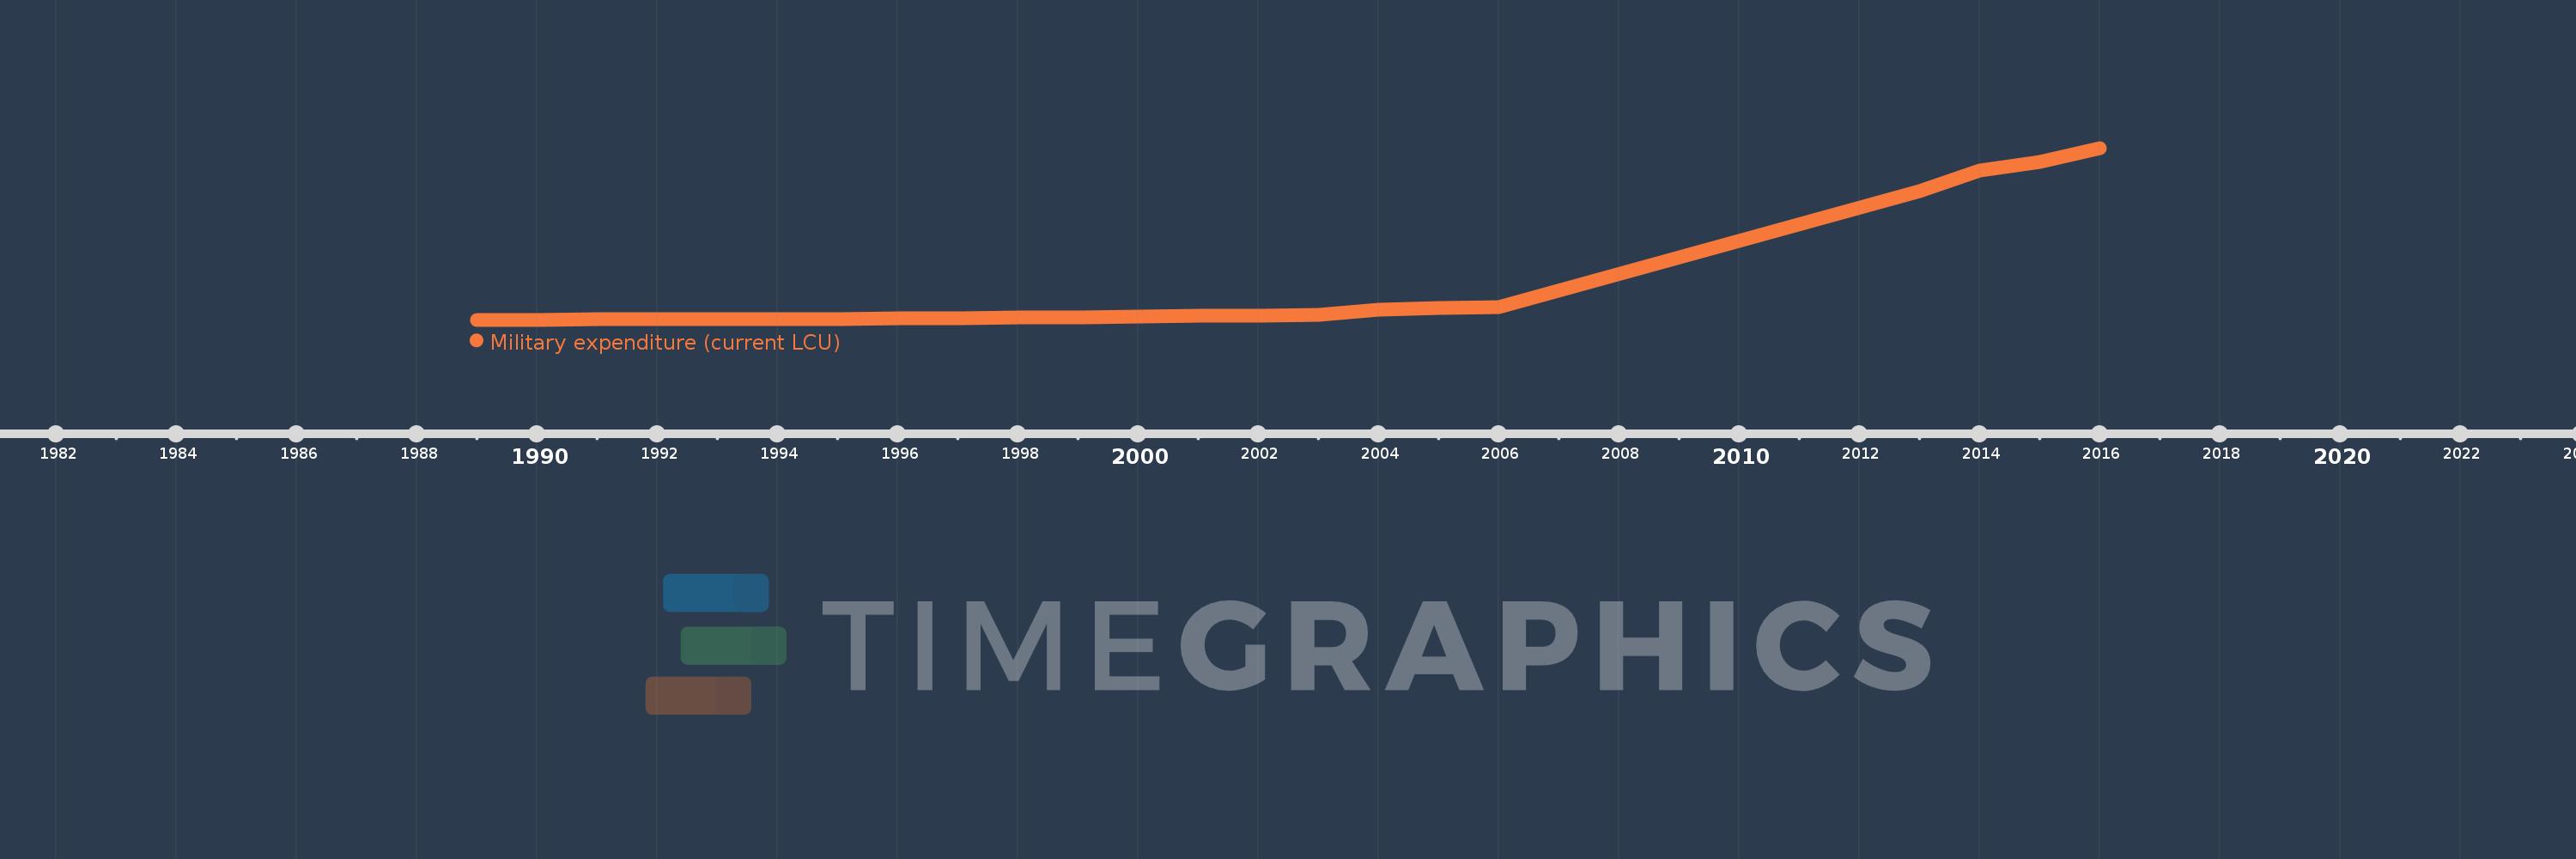
Timeline:
This timeline shows a graph from
1989
to
2016
of Myanmar. No data until
1988
. Number of actual observations by date:
22
.
Source name:
World Development Indicators
Source organization:
Stockholm International Peace Research Institute (SIPRI), Yearbook: Armaments, Disarmament and International Security.
Categories, topics:
Public Sector
Last updated:
apr 23, 2017
Indicators value changes by year
Meaning:
450.956 bln
Minimum:
1.632 bln
jan 1, 1989
Maximum:
2.549 trl
jan 1, 2016
At the date of observation
Value
Absolute change
Change from the previous value
jan 1, 1989
1.632 bln
+1.632 bln
0.0%
jan 1, 1990
3.689 bln
+2.057 bln
126.01%
jan 1, 1991
5.16 bln
+1.471 bln
39.87%
jan 1, 1992
5.923 bln
+763.75 mln
14.8%
jan 1, 1993
8.366 bln
+2.442 bln
41.23%
jan 1, 1994
12.694 bln
+4.329 bln
51.74%
jan 1, 1995
16.741 bln
+4.047 bln
31.88%
jan 1, 1996
22.283 bln
+5.542 bln
33.1%
jan 1, 1997
27.667 bln
+5.384 bln
24.16%
jan 1, 1998
29.839 bln
+2.172 bln
7.85%
jan 1, 1999
37.254 bln
+7.415 bln
24.85%
jan 1, 2000
43.687 bln
+6.433 bln
17.27%
jan 1, 2001
58.85 bln
+15.163 bln
34.71%
jan 1, 2002
63.874 bln
+5.025 bln
8.54%
jan 1, 2003
73.065 bln
+9.191 bln
14.39%
jan 1, 2004
148.495 bln
+75.43 bln
103.24%
jan 1, 2005
173.327 bln
+24.831 bln
16.72%
jan 1, 2006
191.733 bln
+18.407 bln
10.62%
jan 1, 2013
1.902 trl
+1.711 trl
892.13%
jan 1, 2014
2.21 trl
+307.5 bln
16.17%
jan 1, 2015
2.336 trl
+126.0 bln
5.7%
jan 1, 2016
2.549 trl
+213.25 bln
9.13%
Ranking of countries by current statistics by years
About & Feedback
Terms
Privacy
FAQ
Support 24/7
Cabinet
Get premium
Donate
The service accepts bank transfer (ACH, Wire) or cards (Visa, MasterCard, etc). Processed by Stripe.
Secured with SSL