33
/
AIzaSyB4mHJ5NPEv-XzF7P6NDYXjlkCWaeKw5bc
November 30, 2025
199916
Mongolia
MNG
true
2
1
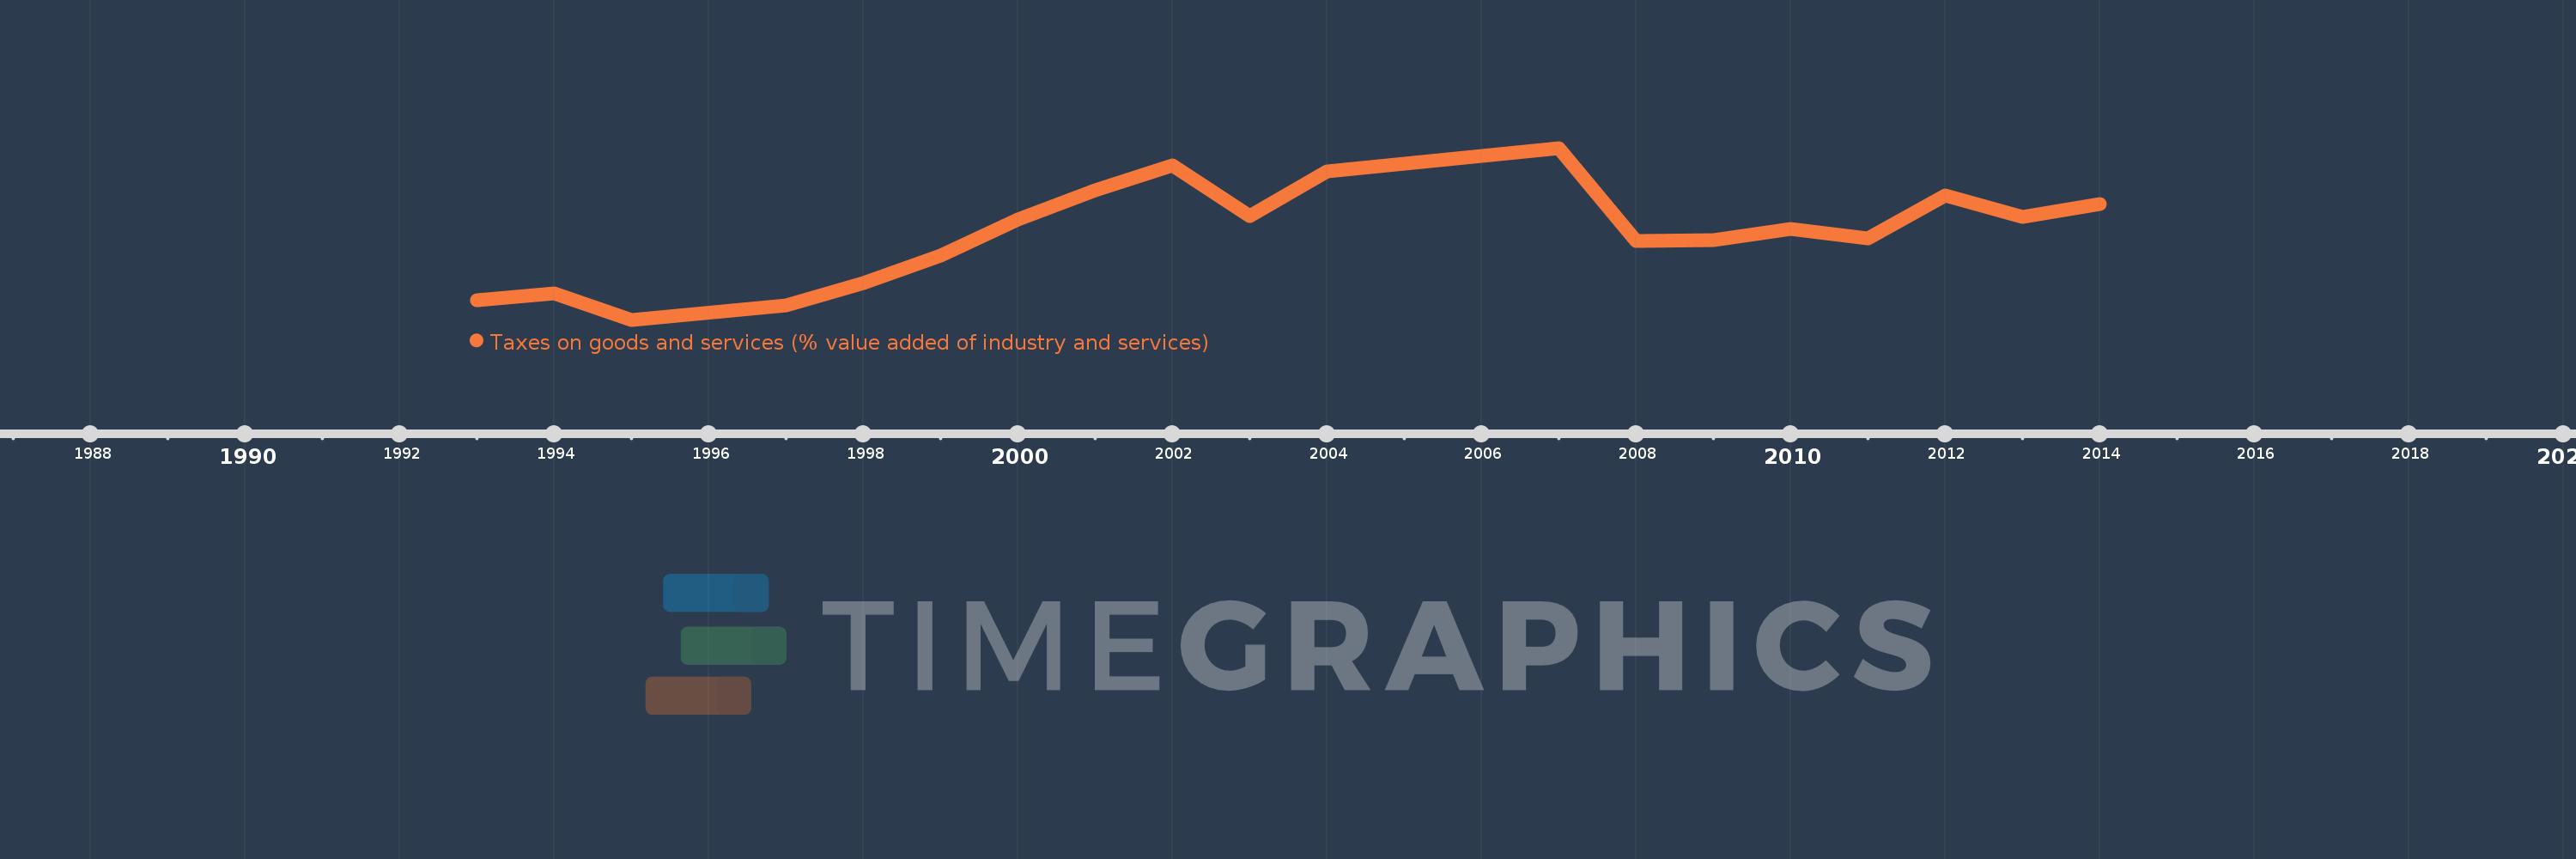
Taxes on goods and services (% value added of industry and services)
2014,2013,2012,2011,2010,2009,2008,2007,2004,2003,2002,2001,2000,1999,1998,1997,1995,1994,1993