33
/
AIzaSyB4mHJ5NPEv-XzF7P6NDYXjlkCWaeKw5bc
November 30, 2025
198495
Monaco
MCO
true
2
1
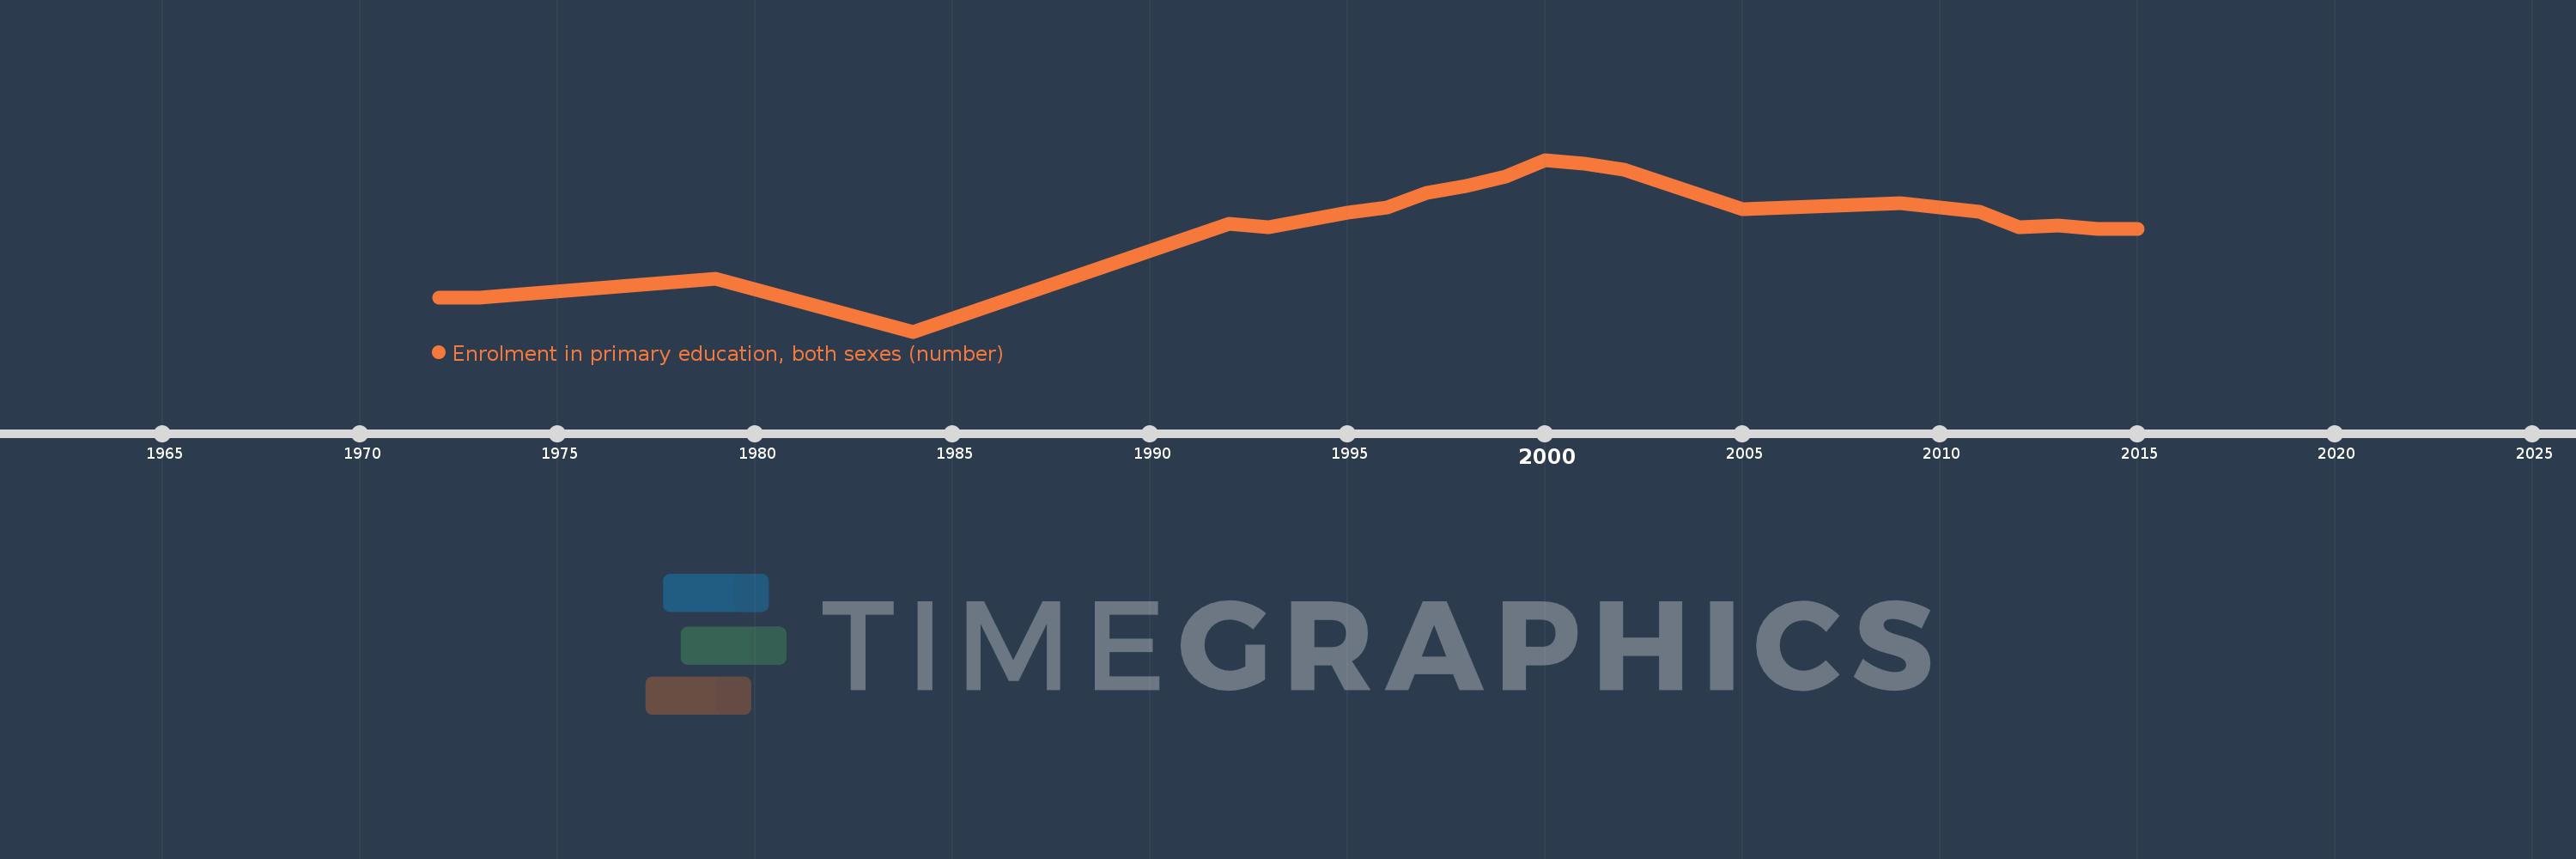
Enrolment in primary education, both sexes (number)
2015,2014,2013,2012,2011,2010,2009,2005,2002,2001,2000,1999,1998,1997,1996,1995,1993,1992,1984,1979,1973,1972