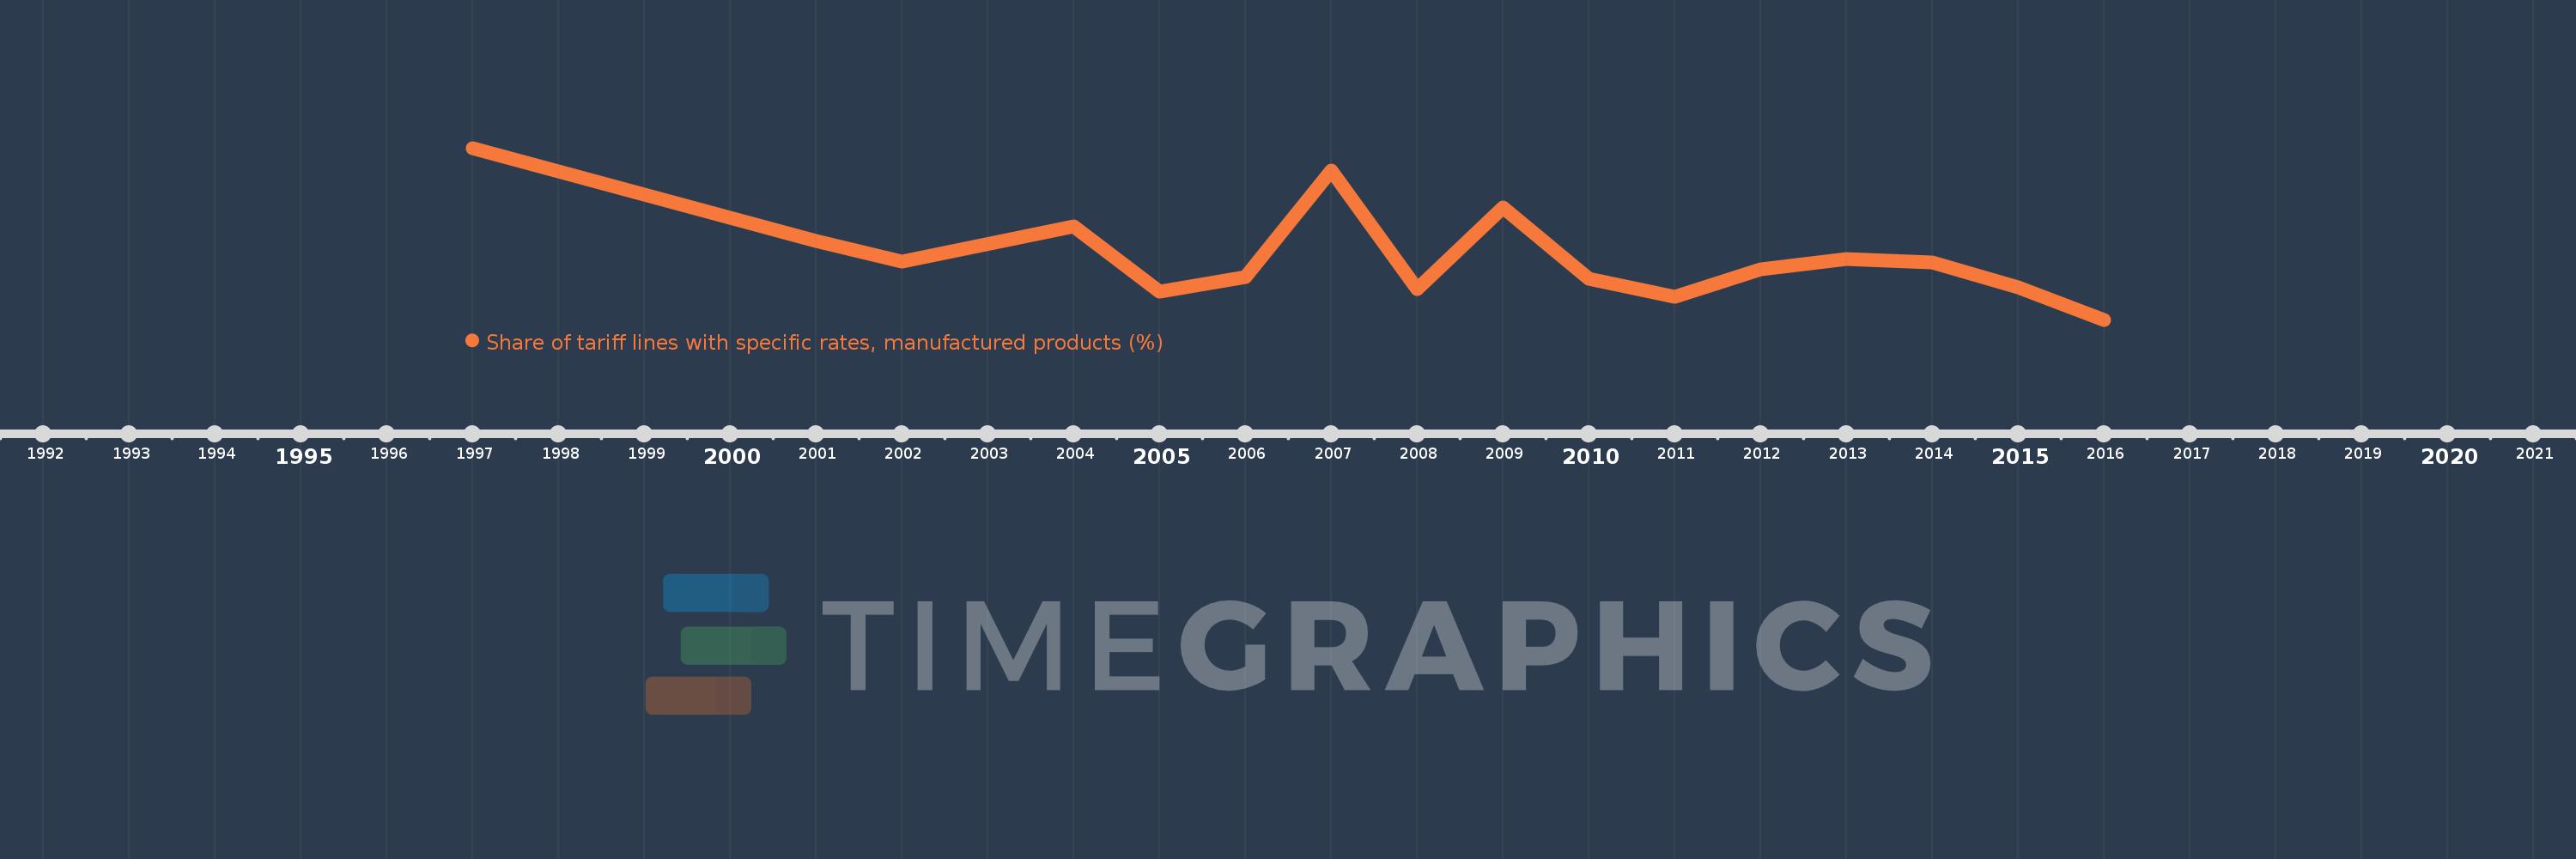
This timeline shows a graph from 1997 to 2016 of Moldova. No data until 1996. Number of actual observations by date: 16.
Source name:
World Development Indicators
Source organization:
World Bank staff estimates using the World Integrated Trade Solution system, based on data from United Nations Conference on Trade and Development's Trade Analysis and Information System (TRAINS) database.
Categories, topics:
Private Sector, Trade
Last updated:
apr 23, 2017
Indicators value changes by year
Meaning:
0.419
Minimum:
0.018
jan 1, 2016
Maximum:
1.089
jan 1, 1997
At the date of observation
Value
Absolute change
Change from the previous value
jan 1, 1997
1.089
+1.089
0.0%
jan 1, 2001
0.507
-0.583
-53.48%
jan 1, 2002
0.381
-0.126
-24.81%
jan 1, 2004
0.599
+0.219
57.38%
jan 1, 2005
0.194
-0.405
-67.6%
jan 1, 2006
0.285
+0.091
46.65%
jan 1, 2007
0.95
+0.665
233.57%
jan 1, 2008
0.207
-0.743
-78.24%
jan 1, 2009
0.717
+0.51
246.6%
jan 1, 2010
0.271
-0.445
-62.15%
jan 1, 2011
0.161
-0.11
-40.56%
jan 1, 2012
0.33
+0.169
104.91%
jan 1, 2013
0.394
+0.064
19.34%
jan 1, 2014
0.374
-0.02
-5.04%
jan 1, 2015
0.221
-0.154
-41.05%
jan 1, 2016
0.018
-0.203
-91.8%
Ranking of countries by current statistics by years